Monocurl Essays
Series Download

Compound interest and where e comes from

Pay 100% interest in more and more instalments and a dollar grows to 2, 2.25, 2.44, 2.61, and then stops short of 2.72. That ceiling is the number e.

22 min·High school·

AssumesWhy x⁰ = 1, and negative and fractional exponents

One dollar at 100% interest per year, with the interest paid once, twice, 4 times and 12 times during the year. Each staircase ends higher than the last, and they close in on the green curve, which ends at about $2.72.
Monocurl source
let fb = Frame(0, 12, 1, 2.85, [0.2, 0.25, 0], 6.2, 2.95)
let Curve = |upto| Graph(fb, |m| exp(m / 12), 0, upto, LEAF, 4.5)
mesh plot = Plot(fb, [3, 6, 9, 12], [1.5, 2, 2.5], "months", "balance ($)", 0.95, 0, 1)
mesh s1 = Stair(fb, 1, 1, upto: 0.05, SLATE)
mesh s2 = []
mesh s4 = []
mesh s12 = []
mesh curve = []
mesh rows = []

slide "stairs"
    s1.upto = 12
    play Lerp(1.1, [&s1], linear)
    rows = [Row(1.6, "once", money(2), SLATE)]
    play Fade(0.3, [&rows])
    s2 = Stair(fb, 1, 2, upto: 0.05, PLUM)
    play Set([&s2])
    s2.upto = 12
    play Lerp(1.1, [&s2], linear)
    rows .= Row(1.3, "twice", money(1.5 ^ 2), PLUM)
    play Fade(0.3, [&rows])
    s4 = Stair(fb, 1, 4, upto: 0.05, AZURE)
    play Set([&s4])
    s4.upto = 12
    play Lerp(1.1, [&s4], linear)
    rows .= Row(0.92, "4 times", money(1.25 ^ 4), AZURE)
    play Fade(0.3, [&rows])
    s12 = Stair(fb, 1, 12, upto: 0.05, EMBER)
    play Set([&s12])
    s12.upto = 12
    play Lerp(1.1, [&s12], linear)
    rows .= Row(0.62, "12 times", money((1 + 1 / 12) ^ 12), EMBER)
    play Fade(0.3, [&rows])
    curve = Curve(upto: 0.05)
    play Set([&curve])
    curve.upto = 12
    play Lerp(1.3, [&curve], linear)
    rows .= Row(0.14, "continuously", money(E), LEAF)
    play Fade(0.3, [&rows])
    play Wait(1.8)

Uses the shared definitions for this lesson's figures.

A bank offers you 100% interest per year. Put in one dollar and a year later you have two. Now suppose a second bank offers the same 100% but pays it in two halves: 50% after six months and another 50% at the end of the year. That sounds like the same deal, and it pays more, because the second 50% is taken on $1.50 and not on $1. You finish with $2.25.

If splitting the year in two earns an extra quarter, split it further. Pay 25% four times, or a twelfth of 100% every month, or a sliver every second. Each split adds a little. So here is the question: by paying the same 100% in enough instalments, can a bank turn your dollar into a hundred dollars by the end of the year? Into a million?

Splitting the year

Start with the case of two payments and watch where each cent comes from.

  1. Start with one dollar.
  2. After six months the bank pays 50%% of the balance, which is 50 cents.
  3. After twelve months it pays 50%% of $1.50: another 50 cents on the dollar, and 25 cents on the first interest.
One dollar at 100% per year, paid as 50% twice. The second payment is 50% of $1.50, so it contains 25 cents of interest on the earlier interest.
Monocurl source
let BASE = -1.5
let U = 1.42
let Slab = |x, lo, hi, col, txt| [
    Shape([[x - 0.78, BASE + lo * U, 0], [x + 0.78, BASE + lo * U, 0], [x + 0.78, BASE + hi * U, 0], [x - 0.78, BASE + hi * U, 0]], col, 0.35, 2.5),
    center{[x, BASE + (lo + hi) / 2 * U, 0]} Math(txt, 0.78, INK)
]
let Foot = |x, total| center{[x, BASE + total * U + 0.3, 0]} Math(money(total), 0.85, INK)
mesh grid = block {
    for (v in [1, 2]) {
        . Seg([-3.25, BASE + v * U, 0], [3.6, BASE + v * U, 0], MIST, 1.5)
        . center{[-3.5, BASE + v * U, 0]} Math(money(v, 0), 0.72, SLATE)
    }
    . Seg([-3.25, BASE, 0], [3.6, BASE, 0], SLATE, 2.5)
    . center{[-2.35, BASE - 0.32, 0]} Note("start", 0.72)
    . center{[-0.55, BASE - 0.32, 0]} Note("6 months", 0.72)
    . center{[1.25, BASE - 0.32, 0]} Note("12 months", 0.72)
}
# faint outlines of the three balances, so the later columns have a place from the start
mesh ghost = map([[-2.35, 1], [-0.55, 1.5], [1.25, 1.5 * 1.5]], |g|
    Path([[g[0] - 0.78, BASE, 0], [g[0] - 0.78, BASE + g[1] * U, 0], [g[0] + 0.78, BASE + g[1] * U, 0], [g[0] + 0.78, BASE, 0]], MIST, 2)
)
mesh b0 = []
mesh b1 = []
mesh b2 = []
mesh names = []

slide "Start with one dollar."
    b0 = [Slab(-2.35, 0, 1, AZURE, "1.00"), Foot(-2.35, 1)]
    names = [center{[2.9, BASE + 0.5 * U, 0]} Cap("the dollar", 0.72, AZURE)]
    play Fade(0.6)

slide "After six months the bank pays 50%% of the balance, which is 50 cents."
    b1 = [Slab(-0.55, 0, 1, AZURE, "1.00"), Slab(-0.55, 1, 1.5, EMBER, "0.50"), Foot(-0.55, 1.5)]
    names .= center{[2.9, BASE + 1.25 * U + 0.16, 0]} Cap("interest on", 0.72, EMBER)
    names .= center{[2.9, BASE + 1.25 * U - 0.16, 0]} Cap("the dollar", 0.72, EMBER)
    play Fade(0.6)

slide "After twelve months it pays 50%% of $1.50: another 50 cents on the dollar, and 25 cents on the first interest."
    b2 = [
        Slab(1.25, 0, 1, AZURE, "1.00"), Slab(1.25, 1, 1.5, EMBER, "0.50"),
        Slab(1.25, 1.5, 2, EMBER, "0.50"), Slab(1.25, 2, 2.25, LEAF, "0.25"),
        Foot(1.25, 2.25)
    ]
    names .= center{[2.9, BASE + 2 * U + 0.5, 0]} Cap("interest on", 0.72, LEAF)
    names .= center{[2.9, BASE + 2 * U + 0.18, 0]} Cap("interest", 0.72, LEAF)
    play Fade(0.6)

Uses the shared definitions for this lesson's figures.

The dollar itself earns the same total either way: 50 cents twice is the same as a dollar once. The extra quarter is the green piece, the interest that the first 50 cents earned during the second half of the year. Paying interest and then paying interest on the result is called compounding, and the green piece is the whole reason compounding beats a single payment.

There is a quicker way to do the arithmetic. Adding 50% to a balance is the same as multiplying it by $1.5$, so two payments multiply the dollar by $1.5$ twice: $1.5^2 = 2.25$. With four payments of 25% each, the balance is multiplied by $1.25$ four times:

$$ 1.25^4 = 2.44140625. $$

In general, if the year is cut into $n$ equal periods and each pays a rate of $\frac{1}{n}$, the dollar is multiplied by $1 + \frac1n$ at the end of every period, $n$ times over. Writing $a_n$ for the balance at the end of the year,

$$ a_n = \left(1 + \frac{1}{n}\right)^n. $$

So $a_1 = 2$, $a_2 = 2.25$ and $a_4 \approx 2.44$. The animation at the top shows the balance during the year for each of these, as a staircase with one step per payment.

Pause and try

Monthly payments give $a_{12} = \left(1 + \frac{1}{12}\right)^{12}$. Before reaching for a calculator, guess: going from 1 payment to 2 gained $0.25, and going from 2 to 4 gained about $0.19. Will going from 4 to 12 gain more than that or less? Then compute it.

Show answerHide answer

$a_{12} = 1.08333\ldots^{12} \approx 2.6130$, so tripling the number of payments gained about $0.17. That is less than the $0.19 that came from merely doubling it. The gains are shrinking.

The numbers level off

The gains shrink, but that alone settles nothing. A sum of shrinking gains can still grow past every bound (the sums $1 + \frac12 + \frac13 + \frac14 + \cdots$ do), so we need more data. Here is the balance at the end of the year when the interest is paid yearly, monthly, weekly, daily, hourly and every minute.

payments per year, $n$rate per paymentbalance $a_n$ after one year
1100%2
250%2.25
425%2.44141
128.33%2.61304
521.92%2.69260
3650.274%2.71457
87600.0114%2.71813
5256000.00019%2.71828
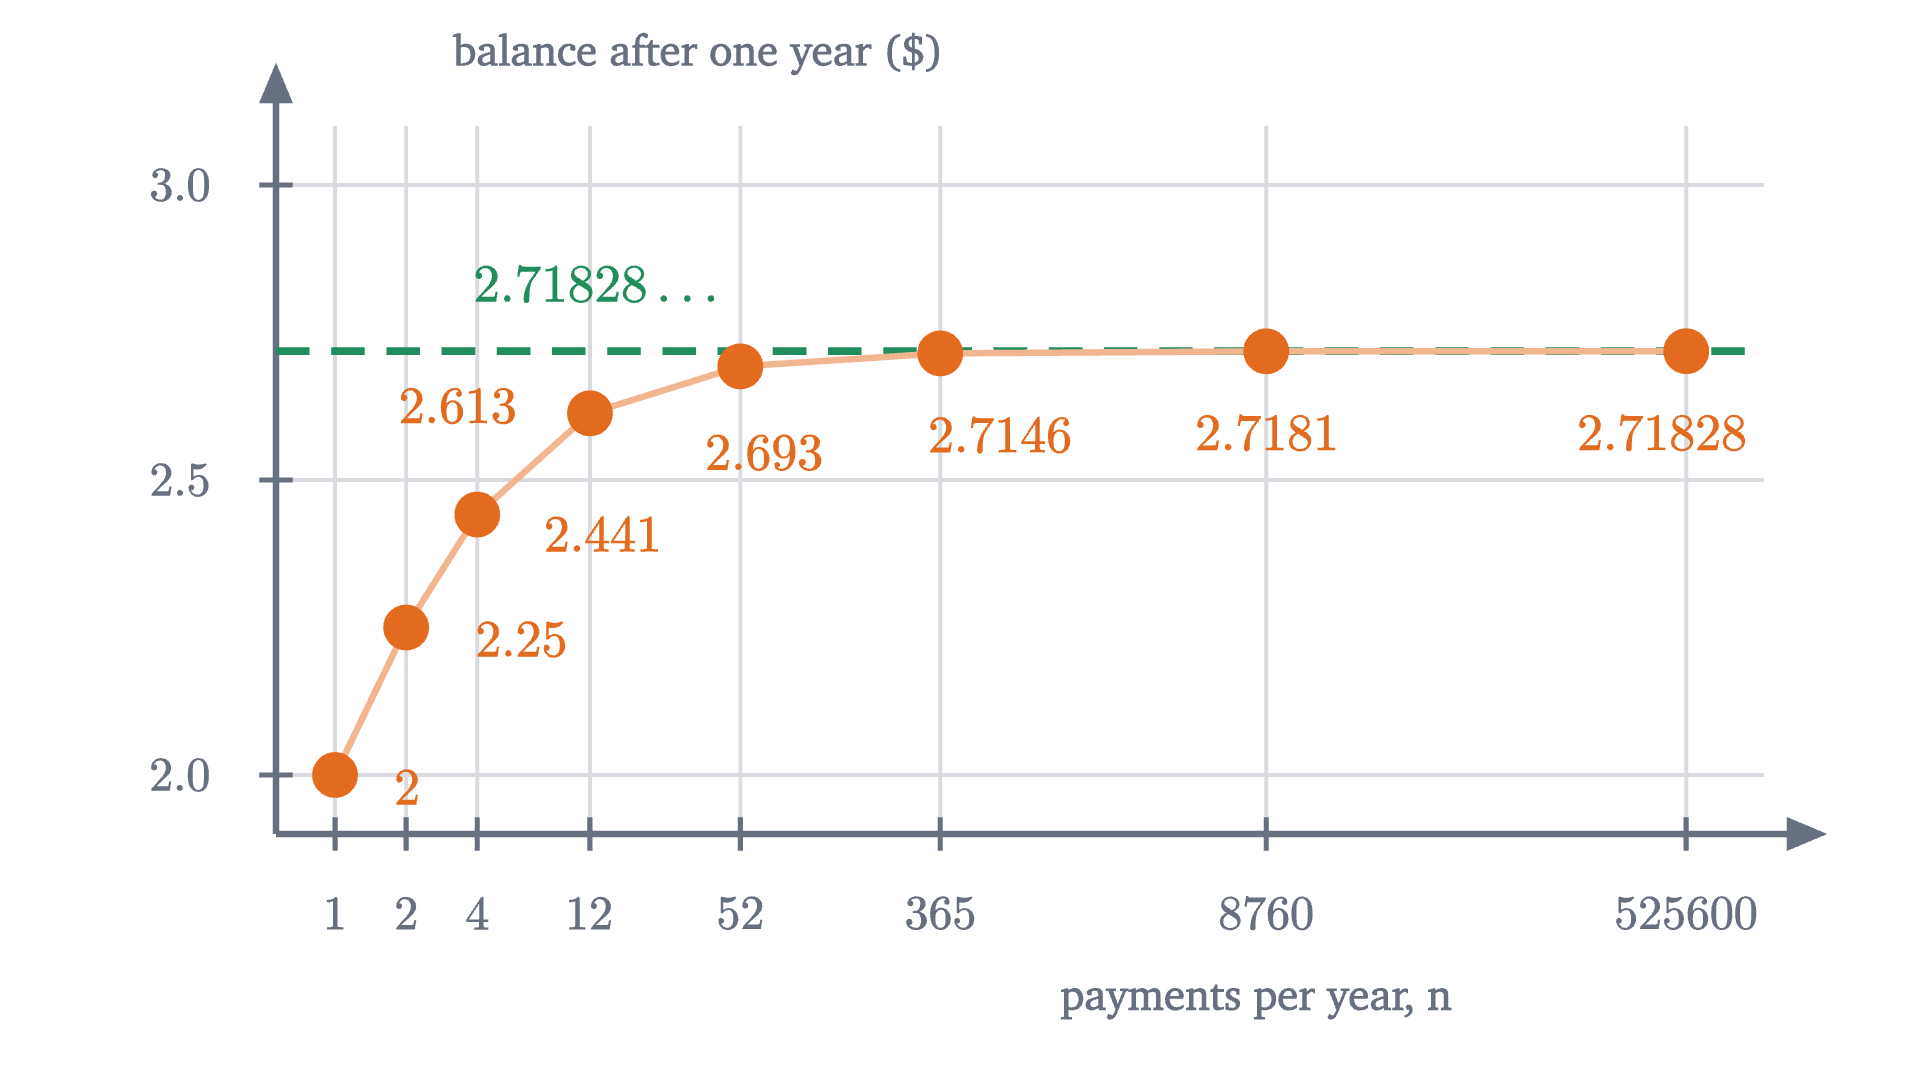
The year-end balance a_n = (1 + 1/n)^n against the number of payments n, which is on a logarithmic scale so that yearly and every-minute payments fit in one picture. The points rise toward the dashed line at 2.71828\ldots and stay below it.
The year-end balance $a_n = (1 + 1/n)^n$ against the number of payments $n$, which is on a logarithmic scale so that yearly and every-minute payments fit in one picture. The points rise toward the dashed line at $2.71828\ldots$ and stay below it.
Monocurl source
let fs = Frame(-0.25, 6.05, 1.9, 3.1, [0.25, 0.25, 0], 6.2, 2.95)
let NS = [1, 2, 4, 12, 52, 365, 8760, 525600]
let a = |n| (1 + 1 / n) ^ n
mesh grid = block {
    for (n in NS) {
        . Seg(at(fs, log10(n), 1.9), at(fs, log10(n), 3.1), MIST, 1.5)
    }
    for (v in [2, 2.5, 3]) {
        . Seg(at(fs, -0.25, v), at(fs, 6.05, v), MIST, 1.5)
    }
}
mesh axes = block {
    . Tip(at(fs, -0.25, 1.9), [fx(fs, 6.05) + 0.25, fy(fs, 1.9), 0], SLATE, 2.5, 0.15)
    . Tip(at(fs, -0.25, 1.9), [fx(fs, -0.25), fy(fs, 3.1) + 0.25, 0], SLATE, 2.5, 0.15)
    for (n in NS) {
        . Seg([fx(fs, log10(n)), fy(fs, 1.9) - 0.07, 0], [fx(fs, log10(n)), fy(fs, 1.9) + 0.07, 0], SLATE, 2)
        . center{[fx(fs, log10(n)), fy(fs, 1.9) - 0.33, 0]} Math(to_string(n), 0.72, SLATE)
    }
    for (v in [2, 2.5, 3]) {
        . Seg([fx(fs, -0.25) - 0.07, fy(fs, v), 0], [fx(fs, -0.25) + 0.07, fy(fs, v), 0], SLATE, 2)
        . center{[fx(fs, -0.25) - 0.4, fy(fs, v), 0]} Math(to_string(v, 1), 0.72, SLATE)
    }
    . center{[fx(fs, 3.9), fy(fs, 1.9) - 0.7, 0]} Note("payments per year, n", 0.72)
    . center{[fx(fs, -0.25) + 1.75, fy(fs, 3.1) + 0.3, 0]} Note("balance after one year ($)", 0.72)
}
mesh limit = [
    stroke{LEAF, 3} dashed{[0.14, 0.09]} Line(at(fs, -0.25, E), at(fs, 6.05, E)),
    center{[fx(fs, 1.1), fy(fs, E) + 0.28, 0]} Math("2.71828\ldots", 0.8, LEAF)
]
mesh path = Path(map(NS, |n| at(fs, log10(n), a(n))), tint(EMBER, 0.5), 2.5)
mesh dots = map(NS, |n| Pt(at(fs, log10(n), a(n)), EMBER, 0.09))
mesh labels = [
    center{[fx(fs, 0) + 0.3, fy(fs, 2) - 0.05, 0]} Math("2", 0.78, EMBER),
    center{[fx(fs, log10(2)) + 0.48, fy(fs, 2.25) - 0.05, 0]} Math("2.25", 0.78, EMBER),
    center{[fx(fs, log10(4)) + 0.52, fy(fs, a(4)) - 0.08, 0]} Math(to_string(a(4), 3), 0.78, EMBER),
    center{[fx(fs, log10(12)) - 0.55, fy(fs, a(12)) + 0.03, 0]} Math(to_string(a(12), 3), 0.78, EMBER),
    center{[fx(fs, log10(52)) + 0.1, fy(fs, a(52)) - 0.36, 0]} Math(to_string(a(52), 3), 0.78, EMBER),
    center{[fx(fs, log10(365)) + 0.25, fy(fs, a(365)) - 0.34, 0]} Math(to_string(a(365), 4), 0.78, EMBER),
    center{[fx(fs, log10(8760)), fy(fs, a(8760)) - 0.34, 0]} Math(to_string(a(8760), 4), 0.78, EMBER),
    center{[fx(fs, log10(525600)) - 0.1, fy(fs, a(525600)) - 0.34, 0]} Math(to_string(a(525600), 5), 0.78, EMBER)
]

Uses the shared definitions for this lesson's figures.

Going from daily to hourly payments adds a third of a cent, and going from hourly to every minute adds less than two hundredths of a cent. The balance appears to be stuck just above $2.718.

A table cannot prove that, though. It shows eight values of $n$, and the claim is about all of them. To be sure that no number of payments reaches $3, let alone a million, we have to understand why the growth stalls.

Why it levels off: generations of interest

Two things happen when $n$ grows. There are more payments, which pushes the balance up, and each payment is at a smaller rate, which pushes it down. The table says these nearly cancel. To see how, sort the money in the account by where it came from, as in the bar figure: the dollar, interest on the dollar, interest on that interest, and so on.

Take $n = 3$, where each payment multiplies the balance by $1 + \frac13$. Multiply out the three factors without simplifying:

$$ \left(1 + \tfrac13\right)\left(1 + \tfrac13\right)\left(1 + \tfrac13\right) = 1 + 3 \cdot \tfrac13 + 3 \cdot \tfrac19 + \tfrac1{27}. $$

Each term of the expansion comes from choosing, in every factor, either the $1$ (the money sits still that period) or the $\frac13$ (it earns interest that period). Choosing $1$ three times gives the dollar. Choosing $\frac13$ in exactly one of the three periods can be done in 3 ways, giving $3 \cdot \frac13 = 1$: the interest on the dollar. Choosing $\frac13$ in two of the periods gives interest that was itself earned on interest, the second generation, and there are 3 ways, each worth $\frac19$. The last term is third-generation interest.

Pause and try

Do the same for $n = 4$: expand $\left(1 + \frac14\right)^4$ as (dollar) + (first generation) + (second generation) + $\cdots$. You will need the number of ways to choose 2 of 4 periods, which is 6, and 3 of 4, which is 4. Which generation changed the most compared with $n = 3$, where the generations were $1, \frac13, \frac1{27}$?

Show answerHide answer

$\left(1 + \frac14\right)^4 = 1 + 4 \cdot \frac14 + 6 \cdot \frac1{16} + 4 \cdot \frac1{64} + \frac1{256} = 1 + 1 + 0.375 + 0.0625 + 0.0039\ldots$, which adds to $2.4414\ldots$ as before. The first generation is exactly 1 again. The second generation rose from $0.333$ to $0.375$, and the third from $0.037$ to $0.0625$. The second generation gained the most, about 4 cents, and all the extra money is in the generations after the first.

The first generation is always exactly $1: $n$ payments of $\frac1n$ on the dollar. That is the cancellation in its simplest form. For the second generation there are more ways to choose two periods as $n$ grows, but each is worth only $\frac{1}{n^2}$. The figure shows how that contest comes out.

  1. One payment: the dollar (blue) and one dollar of interest on it (orange).
  2. Two payments: the orange layer is still one dollar, and a green layer of interest on interest appears, worth a quarter.
  3. Three and four payments: the green layer grows to 1/3 and then 3/8, and a purple third generation shows up above it.
  4. Twelve payments: the green layer is 0.458 and the purple one 0.127. Each is growing more and more slowly.
  5. The caps. However many payments there are, generation k never exceeds 1/k!: the layers cannot pass 1, 1, 1/2, 1/6, 1/24, ...
The year-end balance split into generations of interest for $n = 1, 2, 3, 4, 12$ payments, with the total under each column. Every layer grows with $n$, but each has its own cap, shown by the dashed lines and the last column: $1$, $1$, $\frac12$, $\frac16$, and smaller ones above.
Monocurl source
let LBASE = -1.2
let LU = 1.15
let XS = [-2.6, -1.6, -0.6, 0.4, 1.4]
let Column = |x, n, w = 0.76| block {
    var lo = 0
    for (k in range(0, min(n, 9) + 1)) {
        var term = 1 / factorial(k)
        for (j in range(0, k)) {
            term = term * (1 - j / n)
        }
        if (term * LU > 0.006) {
            . Shape([[x - w / 2, LBASE + lo * LU, 0], [x + w / 2, LBASE + lo * LU, 0], [x + w / 2, LBASE + (lo + term) * LU, 0], [x - w / 2, LBASE + (lo + term) * LU, 0]], LAYERS[k], 0.45, 2)
        }
        lo = lo + term
    }
    . center{[x, LBASE - 0.66, 0]} Math(money(lo), 0.78, INK)
}
let NAMES = ["n = 1", "n = 2", "n = 3", "n = 4", "n = 12"]
mesh scale_marks = block {
    for (v in [1, 2]) {
        . Seg([-3.2, LBASE + v * LU, 0], [3.6, LBASE + v * LU, 0], MIST, 1.5)
    }
    . Seg([-3.2, LBASE, 0], [3.6, LBASE, 0], SLATE, 2.5)
    for (i in range(0, 5)) {
        . center{[XS[i], LBASE - 0.3, 0]} Math(NAMES[i], 0.72, SLATE)
    }
    for (v in [1, 2]) {
        . center{[-3.45, LBASE + v * LU, 0]} Math(money(v, 0), 0.72, SLATE)
    }
}
# faint outlines of every column at its full height, so the later columns have a place from the start
let GhostCol = |x, n, w| {
    let top = LBASE + (1 + 1 / n) ^ n * LU
    return Path([[x - w / 2, LBASE, 0], [x - w / 2, top, 0], [x + w / 2, top, 0], [x + w / 2, LBASE, 0]], MIST, 2)
}
mesh ghost = [
    map(range(0, 5), |i| GhostCol(XS[i], [1, 2, 3, 4, 12][i], 0.76)),
    GhostCol(2.55, 100000000, 0.8)
]
mesh caps = []
mesh c1 = []
mesh c2 = []
mesh c34 = []
mesh c12 = []
mesh lim = []

slide "One payment: the dollar (blue) and one dollar of interest on it (orange)."
    c1 = Column(XS[0], 1)
    play Fade(0.6)

slide "Two payments: the orange layer is still one dollar, and a green layer of interest on interest appears, worth a quarter."
    c2 = Column(XS[1], 2)
    play Fade(0.6)

slide "Three and four payments: the green layer grows to 1/3 and then 3/8, and a purple third generation shows up above it."
    c34 = [Column(XS[2], 3), Column(XS[3], 4)]
    play Fade(0.6)

slide "Twelve payments: the green layer is 0.458 and the purple one 0.127. Each is growing more and more slowly."
    c12 = Column(XS[4], 12)
    play Fade(0.6)

slide "The caps. However many payments there are, generation k never exceeds 1/k!: the layers cannot pass 1, 1, 1/2, 1/6, 1/24, ..."
    caps = block {
        for (v in [1, 2, 2.5, 2 + 2 / 3]) {
            . stroke{SLATE, 2} dashed{[0.1, 0.08]} Line([-3.2, LBASE + v * LU, 0], [2.15, LBASE + v * LU, 0])
        }
    }
    lim = [
        Column(2.55, 100000000, 0.8),
        center{[2.55, LBASE - 0.3, 0]} Math("\text{cap}", 0.72, SLATE),
        center{[3.3, LBASE + 0.5 * LU, 0]} Math("1", 0.85, AZURE),
        center{[3.3, LBASE + 1.5 * LU, 0]} Math("1", 0.85, EMBER),
        center{[3.3, LBASE + 2.25 * LU, 0]} Math("1/2", 0.8, LEAF),
        center{[3.3, LBASE + 2.59 * LU, 0]} Math("1/6", 0.8, PLUM)
    ]
    play Fade(0.7)

Uses the shared definitions for this lesson's figures.

Here is the reason for the caps, on the second generation. The number of ways to choose 2 periods out of $n$ is $\frac{n(n-1)}{2}$, so the second generation is worth

$$ \frac{n(n-1)}{2} \cdot \frac{1}{n^2} = \frac12 \cdot \frac{n-1}{n} = \frac12\left(1 - \frac1n\right). $$

For $n = 2, 3, 4, 12$ this is $\frac14, \frac13, \frac38, \frac{11}{24}$, the green layers of the figure. It grows with $n$, and it is always less than $\frac12$. Interest on interest can never be worth more than 50 cents, however finely the year is cut. The same calculation caps the third generation at $\frac16$ and the fourth at $\frac1{24}$, and those caps shrink so fast that the caps on the second generation and all the later ones together add up to less than a dollar. That is the idea. To make it a proof we need the general formula for the layers, which is the binomial theorem.

The theorem: increasing, and never as large as 3

For whole numbers $0 \le k \le n$, write $\binom{n}{k}$ for the number of ways to choose $k$ of $n$ things. Choosing them in order can be done in $n(n-1)\cdots(n-k+1)$ ways, and each set of $k$ things gets counted once for each of its $k! = k(k-1)\cdots 2 \cdot 1$ orderings, so

$$ \binom{n}{k} = \frac{n(n-1)(n-2)\cdots(n-k+1)}{k!}. $$

The binomial theorem, proved in the lesson on Pascal’s triangle, says that $(1 + x)^n = \sum_{k=0}^{n} \binom{n}{k} x^k$, and the reason is the one we used for $n = 3$: a term $x^k$ arises once for every way of choosing the $x$ from $k$ of the $n$ factors.

Read the proof against the picture. Formula $(*)$ is the height of one colored layer. Part 1 says each layer is taller in the next column and a new layer is added on top. Part 2 says layer $k$ never passes its dashed cap $\frac{1}{k!}$, and that the caps add up to less than 3.

So the answer to the opening question is no. Under every payment schedule the dollar ends the year below $3.

The number e

We know the balances $a_1, a_2, a_3, \ldots$ increase and never reach 3. They look as though they are closing in on a particular number, and we should say what that means.

The number $\varepsilon$ is a tolerance, and the definition says that whatever tolerance is demanded, the sequence is eventually within it and stays within it. Our sequence cannot go back down and cannot pass 3, so its values ought to pile up somewhere at or below 3. They do, and that is a theorem about the real numbers that we will use without proving.

This is proved in a first course in real analysis, and it rests on the property that separates the real numbers from the fractions: the number line has no gaps. (Among fractions alone it is false. The increasing sequence $1.4, 1.41, 1.414, \ldots$ of decimal truncations of $\sqrt2$ is bounded above by 2 and has no fraction as its limit.) Our sequence is increasing and bounded above by 3, so the theorem applies, and the limit gets a name.

Notice what has and has not been shown. We proved that the limit exists and is at most 3, and since $a_{525600} \approx 2.71828$ and the sequence increases, $e > 2.71827$. We have not proved the digits beyond those, though Problem 8 gives a way to compute as many as you like. And $e$ is not a fraction: Euler proved in 1737 that it is irrational, so its decimal expansion never repeats.

Other rates and other lengths of time

Real banks do not pay 100%. Suppose the rate is $r$ per year, written as a decimal (6% is $r = 0.06$), paid in $n$ instalments of $\frac{r}{n}$. One dollar becomes $\left(1 + \frac{r}{n}\right)^n$ after a year. For $1000 at 6%:

payments per yearbalance after one year
1$1060.00
12$1061.68
365$1061.83
limit$1061.84

Again there is a ceiling. Is it a new number for each rate, or is it related to $e$?

Pause and try

At a 50% rate, what do you expect one dollar to approach as the payments become continuous? Two natural guesses: half as much growth as at 100%, that is $1 + \frac{e - 1}{2} \approx 1.859$; or something else. Test your guess by computing $\left(1 + \frac{0.5}{n}\right)^n$ for $n = 1000$.

Show answerHide answer

$1.0005^{1000} \approx 1.6485$, well short of $1.859$. Half the rate gives less than half the growth, because there is also less interest on interest. The number is close to $\sqrt{e} = e^{0.5} \approx 1.6487$, and here is why. A 50% rate for one year, in 1000 payments of 0.05%, is the same schedule as a 100% rate in payments of 0.05% that is stopped after half a “year” of 2000 payments. Stopping the growth to $e$ halfway through its exponent gives $e^{1/2}$.

The same reasoning works for every positive rate. Paying $\frac{r}{n}$ per period is what a 100% bank does if it makes $x = \frac{n}{r}$ payments a year, since then each payment is $\frac1x = \frac{r}{n}$. Our $n$ payments are $r$ years’ worth of that bank’s schedule:

$$ \left(1 + \frac{r}{n}\right)^n = \left(1 + \frac1x\right)^{x r} = \left[\left(1 + \frac1x\right)^{x}\right]^{r}, \qquad x = \frac{n}{r}. $$

As $n \to \infty$, $x \to \infty$ too, the square bracket approaches $e$, and the whole expression approaches $e^r$.

For $r = 0$ the statement reads $1 = 1$. For negative $r$ the theorem is still true and we will not prove it in general; Problem 6 does the case $r = -1$.

Now let the money stay for $t$ years, with $n$ payments per year. There are $nt$ payments in all, and

$$ P\left(1 + \frac{r}{n}\right)^{nt} = P\left[\left(1 + \frac{r}{n}\right)^{n}\right]^{t} \longrightarrow P\,(e^r)^t = P e^{rt} \quad \text{as } n \to \infty. $$
One curve covers every rate and every length of time: a dollar compounded continuously at rate $r$ for $t$ years is worth $e^{rt}$, the height of this curve above the point $rt$. At $rt = 1$ the height is $e$.
Monocurl source
let fe = Frame(0, 2.1, 0, 8.4, [0.2, 0.25, 0], 6.2, 2.95)
let Ride = |x| [
    Seg(at(fe, x, 0), at(fe, x, exp(x)), EMBER, 3),
    Pt(at(fe, x, exp(x)), EMBER, 0.1),
    center{[-2.0, 1.1, 0]} scale{1.3} color{EMBER} Number(x, 2),
    center{[-0.3, 1.1, 0]} scale{1.3} color{AZURE} Number(exp(x), 3)
]
mesh plot = Plot(fe, [0.5, 1, 1.5, 2], [2, 4, 6, 8], "rate × years", "balance per dollar ($)", 1.55, 1, 0)
mesh curve = Graph(fe, exp, 0, 2.08, AZURE, 4.5)
mesh marks = [
    Pt(at(fe, 0.5, exp(0.5)), LEAF, 0.08),
    Pt(at(fe, 1, E), LEAF, 0.08),
    Pt(at(fe, 2, exp(2)), LEAF, 0.08),
    center{[fx(fe, 0.5) + 0.5, fy(fe, exp(0.5)) - 0.2, 0]} Math(to_string(exp(0.5), 3), 0.76, LEAF),
    center{[fx(fe, 1) - 0.75, fy(fe, E) + 0.25, 0]} Math("e = 2.718", 0.76, LEAF),
    center{[fx(fe, 2) - 0.55, fy(fe, exp(2)) + 0.05, 0]} Math(to_string(exp(2), 3), 0.76, LEAF)
]
mesh heads = [
    center{[-2.0, 1.43, 0]} Cap("rate × years", 0.72, EMBER),
    center{[-0.3, 1.43, 0]} Cap("balance", 0.72, AZURE)
]
mesh ride = Ride(x: 0.02)

slide "ride"
    play Wait(0.5)
    ride.x = 0.5
    play Lerp(1.4, [&ride])
    play Wait(0.5)
    ride.x = 1
    play Lerp(1.4, [&ride])
    play Wait(0.5)
    ride.x = 2
    play Lerp(1.8, [&ride])
    play Wait(1.5)

Uses the shared definitions for this lesson's figures.

Only the product $rt$ matters. Six percent for ten years, 10% for six years and 60% for one year all multiply the money by $e^{0.6} \approx 1.822$ under continuous compounding.

Doubling time

A quantity that grows as $Pe^{rt}$ has a property that straight-line growth lacks. Ask how long it takes to double: we need $e^{rT} = 2$. The exponent to which $e$ must be raised to give 2 is called the natural logarithm of 2, written $\ln 2$, and its value is $0.6931\ldots$ (you can check that $e^{0.6931} \approx 2.0000$; the next lesson is about such exponents). So $rT = \ln 2$ and

$$ T = \frac{\ln 2}{r} \approx \frac{0.693}{r}. $$

The starting amount $P$ has cancelled out of this, and so has the starting time: from any moment, the wait until the amount is twice as large is the same $T$.
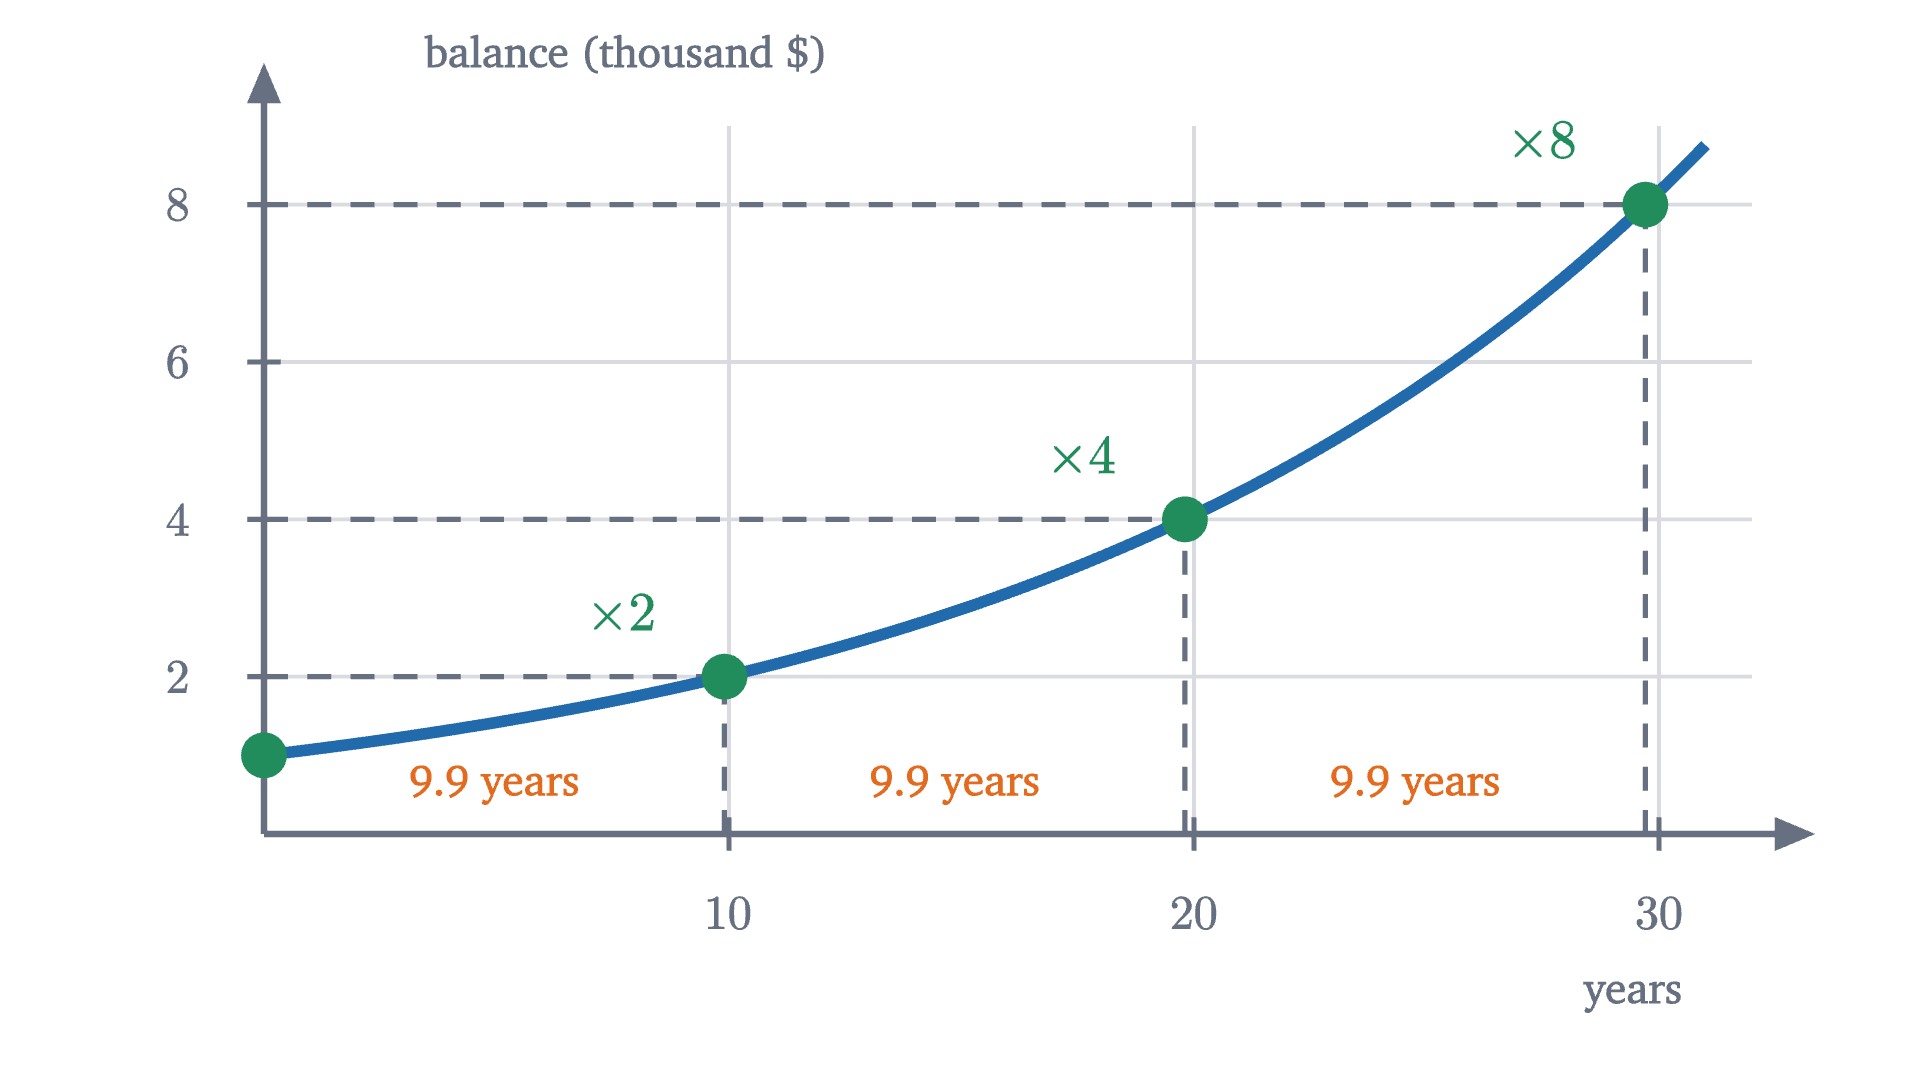
$1000 compounded continuously at 7% per year. The balance doubles every \ln 2 / 0.07 \approx 9.9 years, whether it is going from 1 to 2 thousand or from 4 to 8 thousand.
$1000 compounded continuously at 7% per year. The balance doubles every $\ln 2 / 0.07 \approx 9.9$ years, whether it is going from 1 to 2 thousand or from 4 to 8 thousand.
Monocurl source
let fd = Frame(0, 32, 0, 9, [0.2, 0.25, 0], 6.2, 2.95)
let g = |t| exp(0.07 * t)
let T = ln(2) / 0.07
mesh plot = Plot(fd, [10, 20, 30], [2, 4, 6, 8], "years", "balance (thousand $)", 1.5)
mesh guides = block {
    for (k in [1, 2, 3]) {
        . stroke{SLATE, 2} dashed{[0.1, 0.08]} Line(at(fd, k * T, 0), at(fd, k * T, 2 ^ k))
        . stroke{SLATE, 2} dashed{[0.1, 0.08]} Line(at(fd, 0, 2 ^ k), at(fd, k * T, 2 ^ k))
        . center{at(fd, (k - 0.5) * T, 0.62)} Cap(str_join([to_string(T, 1), " years"]), 0.72, EMBER)
    }
}
mesh curve = Graph(fd, g, 0, 31, AZURE, 4.5)
mesh dots = block {
    . Pt(at(fd, 0, 1), LEAF, 0.09)
    for (k in [1, 2, 3]) {
        . Pt(at(fd, k * T, 2 ^ k), LEAF, 0.09)
        . center{[fx(fd, k * T) - 0.42, fy(fd, 2 ^ k) + 0.27, 0]} Math(str_join(["\times ", to_string(2 ^ k)]), 0.82, LEAF)
    }
}

Uses the shared definitions for this lesson's figures.

With $r$ given as a percentage the formula reads $T \approx \frac{69.3}{\text{percent}}$, which is the rule of 70 used for mental arithmetic: at 7% growth a quantity doubles in about 10 years, at 2% in about 35.

Pause and try

A town’s population grows continuously at 3.5% per year. Roughly how long until it is four times as large?

Show answerHide answer

Doubling takes $\frac{\ln 2}{0.035} \approx 19.8$ years (the rule of 70 gives 20). Quadrupling is doubling twice, so about $39.6$ years. It is not four times the doubling time, because the second doubling starts from the larger population.

Worked examples

Negative rates and decay

Nothing in $\left(1 + \frac{r}{n}\right)^n$ requires $r$ to be positive. Take $r = -1$: a quantity that loses 100% per year, in $n$ instalments. A tank that loses half of what it holds, twice, keeps $\left(\frac12\right)^2 = \frac14$. Losing a quarter four times leaves $\left(\frac34\right)^4 \approx 0.316$. Splitting a loss into instalments softens it, because each later instalment is taken from a smaller amount.
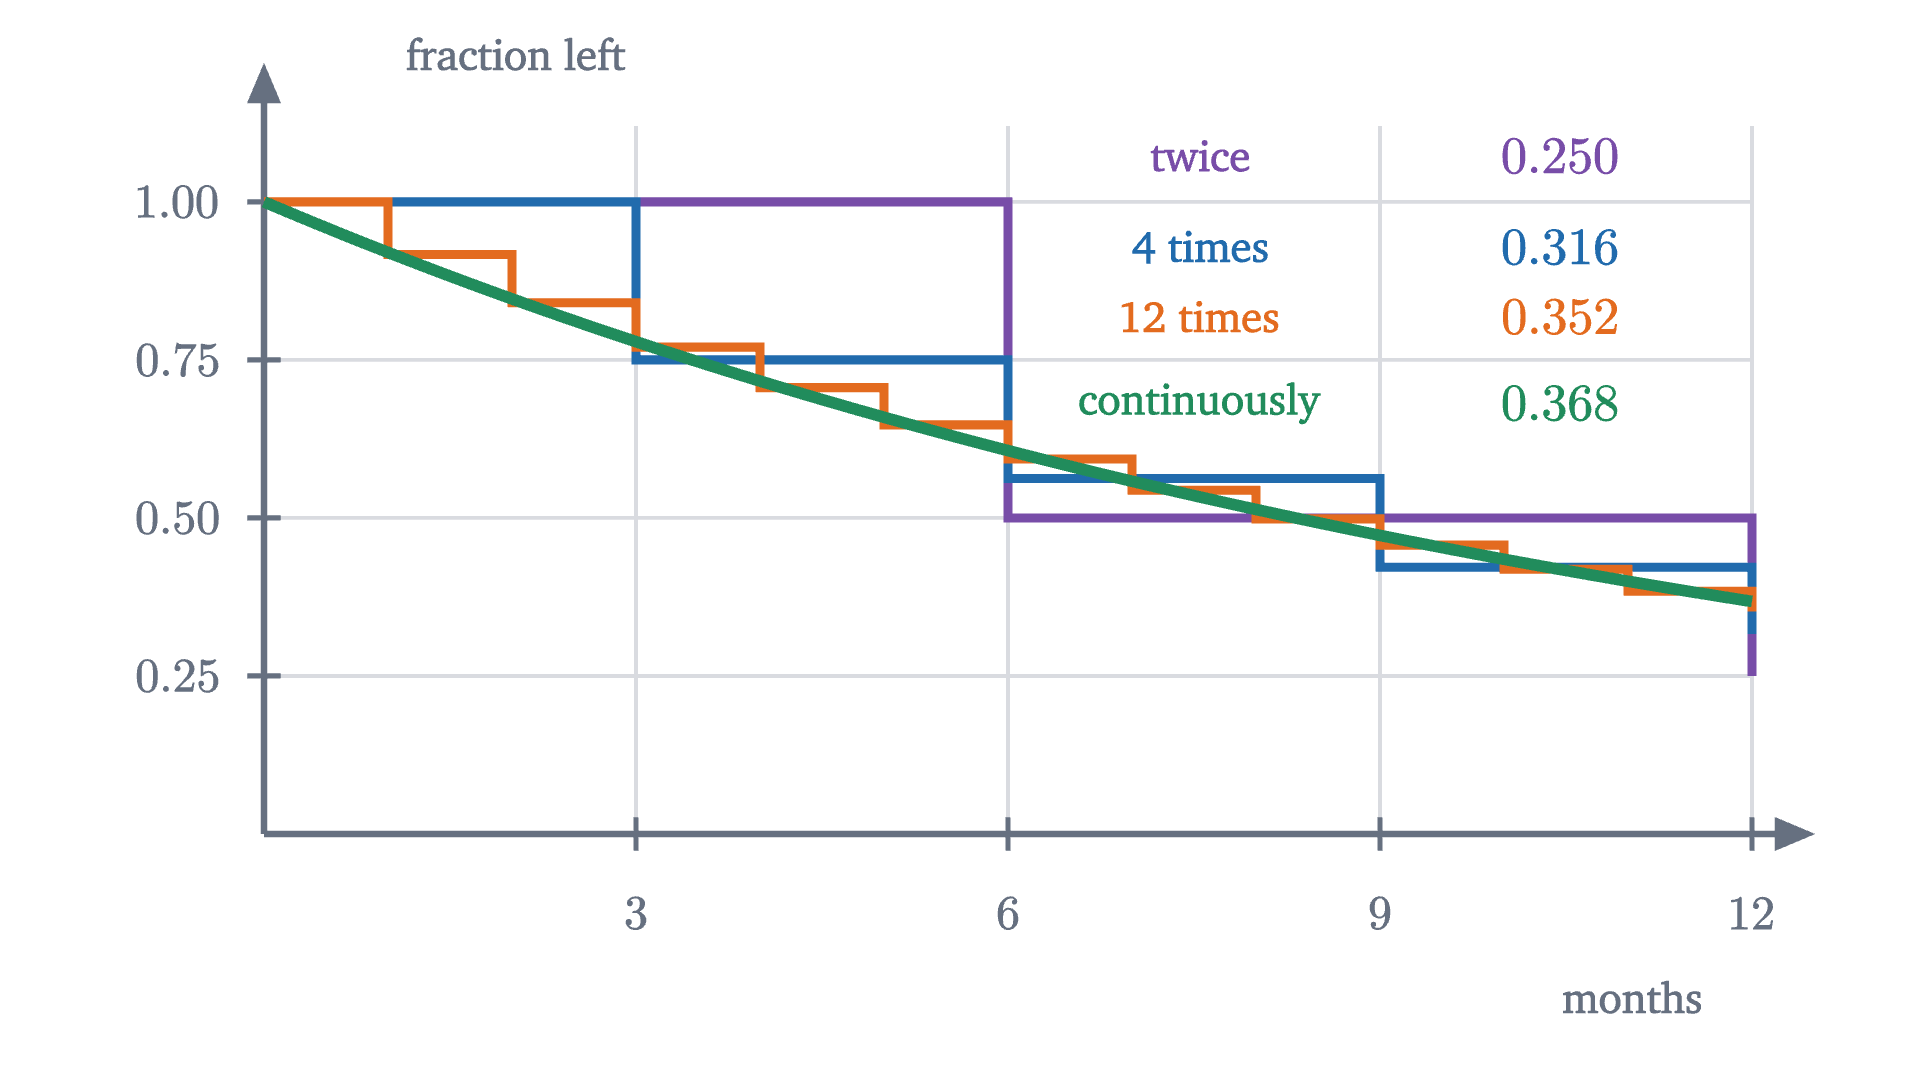
A quantity that loses 100% per year in 2, 4 and 12 instalments, and continuously. The amount left at the end of the year rises with the number of instalments and approaches 1/e \approx 0.368.
A quantity that loses 100% per year in 2, 4 and 12 instalments, and continuously. The amount left at the end of the year rises with the number of instalments and approaches $1/e \approx 0.368$.
Monocurl source
let fn = Frame(0, 12, 0, 1.12, [0.2, 0.25, 0], 6.2, 2.95)
mesh plot = Plot(fn, [3, 6, 9, 12], [0.25, 0.5, 0.75, 1], "months", "fraction left", 1.05, 0, 2)
mesh stairs = [
    Stair(fn, -1, 2, 12, PLUM),
    Stair(fn, -1, 4, 12, AZURE),
    Stair(fn, -1, 12, 12, EMBER)
]
mesh curve = Graph(fn, |m| exp(-m / 12), 0, 12, LEAF, 4.5)
mesh rows = [
    Row(1.6, "twice", to_string(0.5 ^ 2, 3), PLUM, 1.0, 2.5),
    Row(1.22, "4 times", to_string(0.75 ^ 4, 3), AZURE, 1.0, 2.5),
    Row(0.93, "12 times", to_string((11 / 12) ^ 12, 3), EMBER, 1.0, 2.5),
    Row(0.57, "continuously", to_string(1 / E, 3), LEAF, 1.0, 2.5)
]

Uses the shared definitions for this lesson's figures.

In the limit the fraction left is $e^{-1} = \frac1e \approx 0.368$. A quantity that shrinks as $Pe^{-rt}$ with $r > 0$ is said to decay exponentially, and in place of a doubling time it has a half-life $\frac{\ln 2}{r}$, by the same calculation as before. Radioactive atoms and a drug leaving the bloodstream behave this way.

The formula has limits. With a single instalment of $-100\%$ everything is lost at once (the factor $1 + \frac{r}{n}$ is 0), and if $r < -n$ the factor $1 + \frac{r}{n}$ is negative, which describes nothing; the limit is unaffected, since for a fixed $r$ the factor is positive once $n > |r|$. And the model is only as good as its assumption that the growth in each short period is proportional to the amount present. A population that runs out of food stops obeying $Pe^{rt}$.

Where does continuous growth go from here? The balance $Pe^{rt}$ grows at every moment at a rate proportional to its current size, and making “rate at a moment” precise is the job of the derivative. There, $e^x$ will be singled out as the one exponential function whose rate of growth equals its own value.

Check yourself

You put $500 in an account paying 8% per year, compounded continuously. What is it worth after 10 years?

Problems

Work these with pencil, paper and a calculator before opening the solutions. The first three repeat the lesson’s calculations, the next three combine them, and the last two extend the lesson.

Problem 1

Compute $a_3 = \left(1 + \frac13\right)^3$ and $a_5 = \left(1 + \frac15\right)^5$ exactly, as a fraction and as a decimal. Check that $a_3 < a_4 < a_5$, given $a_4 = 2.44140625$.

Show solutionHide solution

$a_3 = \left(\frac43\right)^3 = \frac{64}{27} \approx 2.37037$. $a_5 = \left(\frac65\right)^5 = \frac{7776}{3125} = 2.48832$. Indeed $2.37037 < 2.44141 < 2.48832$, as part 1 of the theorem requires.

Problem 2

$2000 is invested at 4% per year for 3 years. Find the final balance if interest is compounded (a) monthly, (b) continuously.

Show solutionHide solution

(a) The monthly rate is $\frac{0.04}{12}$ and there are 36 payments: $2000\left(1 + \frac{0.04}{12}\right)^{36} \approx 2000 \times 1.127272 = \$2254.54$. (b) $rt = 0.12$, so the balance is $2000\,e^{0.12} \approx 2000 \times 1.127497 = \$2254.99$. The difference is 45 cents. Both exceed the simple-interest value $2000 \times 1.12 = \$2240$.

Problem 3

An investment grows continuously at 5% per year. Find its doubling time exactly and by the rule of 70. How long until it is eight times its starting value?

Show solutionHide solution

$T = \frac{\ln 2}{0.05} \approx \frac{0.6931}{0.05} = 13.86$ years. The rule of 70 gives $\frac{70}{5} = 14$ years. Eight is $2^3$, three doublings, so it takes $3 \times 13.86 \approx 41.6$ years.

Problem 4

For $n = 12$, compute the third generation of interest, $T_3(12) = \binom{12}{3}\frac{1}{12^3}$, and compare it with its cap $\frac{1}{3!}$. Then use formula $(*)$ to find how large $n$ must be for the second generation $T_2(n)$ to be within one cent of its cap of 50 cents.

Show solutionHide solution

$\binom{12}{3} = \frac{12 \cdot 11 \cdot 10}{6} = 220$ and $12^3 = 1728$, so $T_3(12) = \frac{220}{1728} \approx 0.1273$, below the cap $\frac16 \approx 0.1667$. By $(*)$ it is also $\frac16 \cdot \frac{11}{12} \cdot \frac{10}{12}$, which agrees. For the second part, $T_2(n) = \frac12\left(1 - \frac1n\right) = \frac12 - \frac{1}{2n}$, which is within $0.01$ of $\frac12$ when $\frac{1}{2n} \le 0.01$, that is, $n \ge 50$. Weekly payments already capture all but a cent of the interest on interest.

Problem 5

Carbon-14 decays exponentially with a half-life of 5730 years. (a) Find the continuous rate $r$ in the model $Pe^{-rt}$. (b) What fraction of the carbon-14 in a piece of wood remains after 2000 years?

Show solutionHide solution

(a) The half-life is $\frac{\ln 2}{r} = 5730$, so $r = \frac{0.6931}{5730} \approx 0.000121$ per year, about $0.0121\%$ per year. (b) $rt = 2000 \times \frac{\ln 2}{5730} \approx 0.2419$, and $e^{-0.2419} \approx 0.785$. About 78.5% remains. As a check, 2000 years is $\frac{2000}{5730} \approx 0.349$ half-lives, and $\left(\frac12\right)^{0.349} \approx 0.785$.

Problem 6

Show that $\displaystyle\lim_{n \to \infty}\left(1 - \frac1n\right)^n = \frac1e$, using only the definition of $e$ and the rules for limits of products and quotients. (Hint: write $1 - \frac1n$ as $\frac{n-1}{n}$ and take the reciprocal.)

Show solutionHide solution

For $n \ge 2$,

$$ \left(1 - \frac1n\right)^n = \left(\frac{n-1}{n}\right)^n = \frac{1}{\left(\frac{n}{n-1}\right)^n} = \frac{1}{\left(1 + \frac{1}{n-1}\right)^{n}} = \frac{1}{a_{n-1} \cdot \left(1 + \frac{1}{n-1}\right)}, $$

since $\left(1 + \frac{1}{n-1}\right)^n$ is $\left(1 + \frac{1}{n-1}\right)^{n-1}$ times one more factor. As $n \to \infty$, $a_{n-1} \to e$ and $1 + \frac{1}{n-1} \to 1$, so the denominator approaches $e \cdot 1 = e$, which is not zero. The limit of a quotient is the quotient of the limits when the denominator’s limit is nonzero, so the expression approaches $\frac1e$. Numerically, $n = 12$ gives $0.352$ and $\frac1e \approx 0.368$.

Problem 7

The expression $\left(1 + \frac1n\right)^n$ has a base approaching 1 and an exponent growing without bound. Show that two other expressions of the same kind behave quite differently: (a) $\left(1 + \frac{1}{n^2}\right)^n$ approaches 1; (b) $\left(1 + \frac1n\right)^{n^2}$ grows without bound. Use the theorem that $2 \le a_m < 3$ for all $m$.

Show solutionHide solution

(a) Write $\left(1 + \frac{1}{n^2}\right)^n = \left[\left(1 + \frac{1}{n^2}\right)^{n^2}\right]^{1/n} = \left(a_{n^2}\right)^{1/n}$. Since $1 < a_{n^2} < 3$, the expression lies between $1$ and $3^{1/n}$. The $n$-th root of 3 approaches 1 (for instance $3^{1/100} \approx 1.011$), so the expression is squeezed to 1. (b) $\left(1 + \frac1n\right)^{n^2} = \left(a_n\right)^n \ge 2^n$, which exceeds any given bound once $n$ is large. So “base near 1, exponent large” decides nothing by itself; the answer depends on how fast each one moves.

Problem 8

Let $S_m = 1 + 1 + \frac{1}{2!} + \frac{1}{3!} + \cdots + \frac{1}{m!}$, the sum of the first caps. (a) Show that $a_n \le S_n$ for every $n$. (b) Fix $m$. Show that for $n \ge m$, $a_n \ge \sum_{k=0}^{m} T_k(n)$, and by letting $n \to \infty$ deduce $e \ge S_m$. (c) Conclude that $S_m \to e$, and use $S_6$ to estimate $e$.

Show solutionHide solution

(a) In the proof of the theorem, $T_k(n) \le \frac{1}{k!}$ for each $k$, so $a_n = \sum_{k=0}^n T_k(n) \le \sum_{k=0}^n \frac{1}{k!} = S_n$.

(b) For $n \ge m$, $a_n$ is a sum of $n + 1$ nonnegative terms, and keeping only the first $m + 1$ of them can only make it smaller: $a_n \ge \sum_{k=0}^m T_k(n)$. Now hold $m$ fixed and let $n \to \infty$. Each $T_k(n) = \frac{1}{k!}\left(1 - \frac1n\right)\cdots\left(1 - \frac{k-1}{n}\right)$ is a product of a fixed number of factors that each approach 1, so $T_k(n) \to \frac{1}{k!}$, and the sum of these $m + 1$ terms approaches $S_m$. The left side approaches $e$. A limit preserves $\ge$, so $e \ge S_m$.

(c) The sequence $S_m$ is increasing and, by (b), bounded above by $e$, so it has a limit $S \le e$. By (a), $a_n \le S_n \le S$ for every $n$, so $e = \lim a_n \le S$. Hence $S = e$:

$$ e = 1 + 1 + \frac{1}{2!} + \frac{1}{3!} + \frac{1}{4!} + \cdots $$

Numerically $S_6 = 1 + 1 + 0.5 + 0.166667 + 0.041667 + 0.008333 + 0.001389 = 2.718056$, already within $0.0003$ of $e$.

Shared definitions used by this lesson's figures
# house kit: prepended to every essay figure after the std imports

# palette. AZURE and EMBER are the two actors, LEAF marks an answer, ROSE a problem
let PAPER = [1, 1, 1, 1]
let INK = [0.08, 0.09, 0.11, 1]
let SLATE = [0.40, 0.44, 0.50, 1]
let MIST = [0.85, 0.86, 0.88, 1]
let AZURE = [0.13, 0.42, 0.68, 1]
let EMBER = [0.89, 0.42, 0.12, 1]
let LEAF = [0.13, 0.55, 0.36, 1]
let ROSE = [0.78, 0.22, 0.24, 1]
let PLUM = [0.47, 0.30, 0.66, 1]
let GOLD = [0.85, 0.62, 0.08, 1]

background = PAPER

# an opaque pastel of col; use for fills so overlaps do not darken
let tint = |col, amount = 0.18| [
    1 - (1 - col[0]) * amount,
    1 - (1 - col[1]) * amount,
    1 - (1 - col[2]) * amount,
    1
]

# text: Cap for labels, Note for quiet labels, Math for typeset maths
let Cap = |txt, size = 0.75, col = INK| color{col} Text(txt, size, "Charter")
let Note = |txt, size = 0.65| color{SLATE} Text(txt, size, "Charter")
let Math = |tex, size = 0.9, col = INK| color{col} Tex(tex, size)

# a paper rectangle to sit behind text that crosses lines
let Plate = |pos, size| center{pos} fill{PAPER} stroke{alpha{0} PAPER, 0} Rect(size)

# shapes with fill and stroke both set, so no stray black appears
let Pt = |pos, col = INK, r = 0.075| center{pos} fill{col} stroke{col, 1} Circle(r, 48)
let Ring = |pos, col = INK, r = 0.1, w = 3| center{pos} fill{PAPER} stroke{col, w} Circle(r, 48)
let Seg = |a, b, col = INK, w = 3| stroke{col, w} Line(a, b)
let Path = |pts, col = INK, w = 3| stroke{col, w} Polyline(pts)
let Region = |pts, col| fill{col} stroke{alpha{0} col, 0} Polygon(pts)
let Outline = |pts, col = INK, w = 3| fill{alpha{0} PAPER} stroke{col, w} Polygon(pts)
let Shape = |pts, col, amount = 0.18, w = 3| fill{tint(col, amount)} stroke{col, w} Polygon(pts)
let Disc = |pos, r, col, amount = 0.18, w = 3| center{pos} fill{tint(col, amount)} stroke{col, w} Circle(r, 96)
let Box = |pos, size, col, amount = 0.18, w = 3| center{pos} fill{tint(col, amount)} stroke{col, w} Rect(size)
# a line from a to b ending in a small solid arrowhead
let Tip = |a, b, col = INK, w = 3, head = 0.17| {
    let d = normalize([b[0] - a[0], b[1] - a[1], 0])
    let n = [-d[1], d[0], 0]
    let base = [b[0] - d[0] * head, b[1] - d[1] * head, 0]
    return [
        stroke{col, w} Line(a, base),
        fill{col} stroke{col, 1} Polygon([
            b,
            [base[0] + n[0] * head * 0.42, base[1] + n[1] * head * 0.42, 0],
            [base[0] - n[0] * head * 0.42, base[1] - n[1] * head * 0.42, 0]
        ])
    ]
}

# plots. a frame is [x0, x1, y0, y1, centre, width, height]: a data window and the scene box it fills
let Frame = |x0, x1, y0, y1, c = [0, 0, 0], w = 6.4, h = 3.6| [x0, x1, y0, y1, c, w, h]
let fx = |fr, x| fr[4][0] + (x - (fr[0] + fr[1]) / 2) * fr[5] / (fr[1] - fr[0])
let fy = |fr, y| fr[4][1] + (y - (fr[2] + fr[3]) / 2) * fr[6] / (fr[3] - fr[2])
let at = |fr, x, y| [fx(fr, x), fy(fr, y), 0]

# axes through the data origin (or the nearest edge of the window), with optional names
let Axes = |fr, x_name = "", y_name = "", col = SLATE| {
    let ox = clamp(fr[0], 0, fr[1])
    let oy = clamp(fr[2], 0, fr[3])
    var parts = [
        Tip(at(fr, fr[0], oy), [fx(fr, fr[1]) + 0.25, fy(fr, oy), 0], col, 2.5, 0.15),
        Tip(at(fr, ox, fr[2]), [fx(fr, ox), fy(fr, fr[3]) + 0.25, 0], col, 2.5, 0.15)
    ]
    if (x_name != "") {
        parts .= center{[fx(fr, fr[1]) + 0.5, fy(fr, oy), 0]} Math(x_name, 0.8, col)
    }
    if (y_name != "") {
        parts .= center{[fx(fr, ox), fy(fr, fr[3]) + 0.5, 0]} Math(y_name, 0.8, col)
    }
    return parts
}

# tick marks with numbers at the listed data values
let XTicks = |fr, xs, col = SLATE, places = 0| block {
    let oy = fy(fr, clamp(fr[2], 0, fr[3]))
    for (x in xs) {
        . Seg([fx(fr, x), oy - 0.07, 0], [fx(fr, x), oy + 0.07, 0], col, 2)
        . center{[fx(fr, x), oy - 0.33, 0]} Math(to_string(x, places), 0.72, col)
    }
}
let YTicks = |fr, ys, col = SLATE, places = 0| block {
    let ox = fx(fr, clamp(fr[0], 0, fr[1]))
    for (y in ys) {
        . Seg([ox - 0.07, fy(fr, y), 0], [ox + 0.07, fy(fr, y), 0], col, 2)
        . center{[ox - 0.36, fy(fr, y), 0]} Math(to_string(y, places), 0.72, col)
    }
}

# faint grid lines at the listed data values
let GridLines = |fr, xs, ys, col = MIST| block {
    for (x in xs) {
        . Seg(at(fr, x, fr[2]), at(fr, x, fr[3]), col, 1.5)
    }
    for (y in ys) {
        . Seg(at(fr, fr[0], y), at(fr, fr[1], y), col, 1.5)
    }
}

# the graph of f over [a, b], drawn in the frame. values are clamped to the window
let Graph = |fr, f, a, b, col = AZURE, w = 4, n = 160|
    stroke{col, w} Polyline(map(sample(a, b, n), |x| at(fr, x, clamp(fr[2], f(x), fr[3]))))

# the region between the graph of f and the x axis over [a, b]
let AreaUnder = |fr, f, a, b, col = AZURE, amount = 0.2, n = 80| {
    var pts = [at(fr, a, 0)]
    for (x in sample(a, b, n)) {
        pts .= at(fr, x, clamp(fr[2], f(x), fr[3]))
    }
    pts .= at(fr, b, 0)
    return fill{tint(col, amount)} stroke{alpha{0} col, 0} Polygon(pts)
}

# one dollar over a year of 12 months, at yearly rate r paid in n equal instalments, drawn up to month `upto`
let Stair = |fr, r, n, upto, col, w = 3.5| {
    var pts = [at(fr, 0, 1)]
    var bal = 1
    for (k in range(0, n)) {
        let t0 = 12 * k / n
        let t1 = 12 * (k + 1) / n
        if (t0 < upto) {
            if (t1 <= upto) {
                pts .= at(fr, t1, bal)
                bal = bal * (1 + r / n)
                pts .= at(fr, t1, bal)
            } else {
                pts .= at(fr, upto, bal)
            }
        }
    }
    return stroke{col, w} Polyline(pts)
}
# a plot with grid, numbered ticks, an x name under the last tick and a y name beside the arrow
let Plot = |fr, xs, ys, x_name, y_name, y_dx = 1.0, xp = 0, yp = 0| [
    GridLines(fr, xs, ys),
    Axes(fr),
    XTicks(fr, xs, SLATE, xp),
    YTicks(fr, ys, SLATE, yp),
    center{[fx(fr, fr[1]) - 0.5, fy(fr, clamp(fr[2], 0, fr[3])) - 0.68, 0]} Note(x_name, 0.72),
    center{[fx(fr, clamp(fr[0], 0, fr[1])) + y_dx, fy(fr, fr[3]) + 0.3, 0]} Note(y_name, 0.72)
]
let Row = |y, name, value, col, xa = -2.0, xb = -0.62| [
    center{[xa, y, 0]} Cap(name, 0.72, col),
    center{[xb, y, 0]} Math(value, 0.78, col)
]
let money = |v, places = 2| str_join(["\$", to_string(v, places)])
# the layer colours: the dollar, interest on it, interest on interest, and so on
let LAYERS = [AZURE, EMBER, LEAF, PLUM, GOLD, SLATE, SLATE, SLATE, SLATE, SLATE]