Fourier Series Listen To Shapes
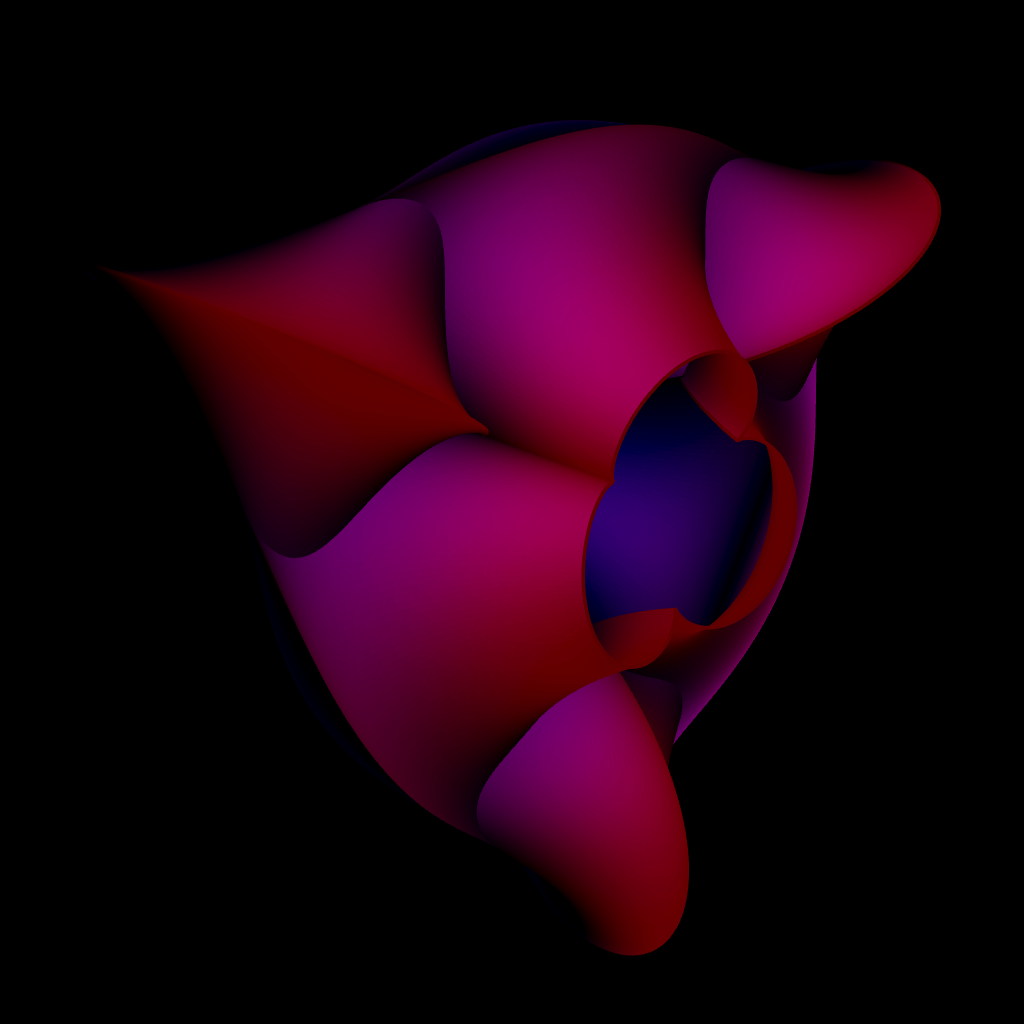
There is a strange promise at the heart of Fourier analysis: if a function repeats, then it can be built from sine and cosine waves.
At first this sounds plausible for smooth, wavy curves. It sounds much less plausible for a square wave, or a sawtooth, or a function with a corner. Those shapes do not look like waves. They look like someone took a ruler to the graph.
The key is that Fourier series do not claim one wave can imitate every shape. They claim that many waves, stacked carefully, can. Low frequencies establish the broad outline. Higher frequencies sharpen edges and correct details.
live slideshowessay-2026-fourier-series-listen-to-shapes-1.mcs
param terms = 1
background = BLACK
camera = Camera(4b)
let square = |x, terms| {
var total = 0
for (k in range(0, terms)) {
let n = 2 * k + 1
total = total + sin(n * x) / n
}
return 0.85 * 4 * total / PI
}
let SquareApprox = |terms| block {
. stroke{BLUE, 3} ExplicitFunc(|x| square(x, terms), [-PI, PI, 320])
}
let Diagram = |terms| block {
. stroke{GRAY, 1} Line(start: [-3.4, 0, 0], end: [3.4, 0, 0])
. stroke{ORANGE, 1.5} Line(start: [-PI, -0.85, 0], end: [0, -0.85, 0])
. stroke{ORANGE, 1.5} Line(start: [0, 0.85, 0], end: [PI, 0.85, 0])
. SquareApprox(terms)
. color{WHITE} center{[0, 1.45, 0]} Text("more frequencies sharpen the edge", 0.88)
}
mesh diagram = Diagram($terms)
"add detail"
terms = 13
play Lerp(1.6)The blue curve is not trying to become a square wave by magic. It is adding odd sine waves:
Each new wave has a smaller amplitude but a higher frequency. The high frequencies are not decoration. They are how the series knows there is a sudden jump.
Orthogonality is the measuring tool
Why do sine waves form such a good language? Because over a full period, different frequencies are orthogonal:
Orthogonality means that one frequency does not impersonate another. If you want to know how much of $\sin(7x)$ is inside a function, you multiply by $\sin(7x)$ and average over a period. All the other sine waves disappear from that measurement.
For a function $f(x)$, the sine coefficient is
That integral is a dot product in disguise. Fourier analysis is linear algebra with functions as vectors.
The ear already knows this
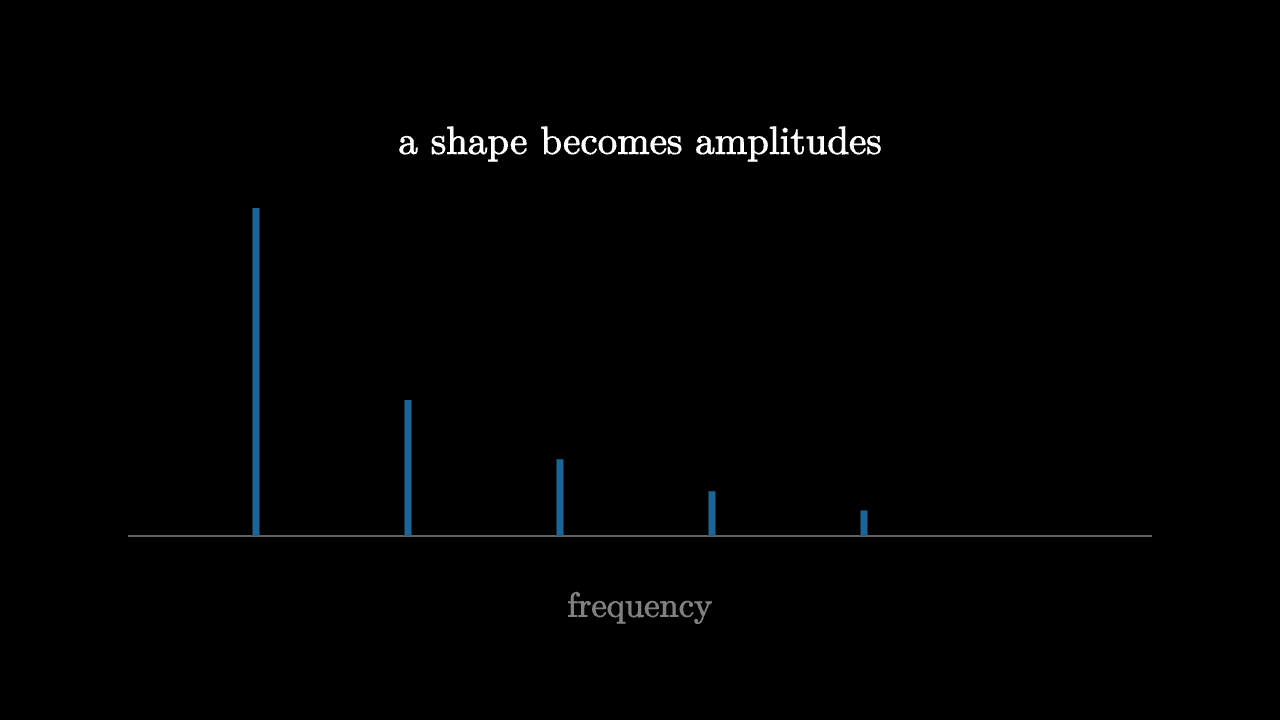
Sound gives the most intuitive version. A violin note and a flute note can have the same fundamental pitch, but they sound different because the higher harmonics have different strengths. Your ear does not hear the raw pressure wave as one indivisible object. It decomposes it into frequencies.
Fourier series says the same idea works for any periodic signal. A shape has a spectrum. The graph is what you see in position space; the coefficients are what you hear in frequency space.
imageessay-2026-fourier-series-listen-to-shapes-2.mcs
background = BLACK
camera = Camera(4b)
mesh diagram = block {
. stroke{GRAY, 1} Line(start: [-3.2, -1.1, 0], end: [3.2, -1.1, 0])
. stroke{BLUE, 4} Line(start: [-2.4, -1.1, 0], end: [-2.4, 0.95, 0])
. stroke{BLUE, 4} Line(start: [-1.45, -1.1, 0], end: [-1.45, -0.25, 0])
. stroke{BLUE, 4} Line(start: [-0.5, -1.1, 0], end: [-0.5, -0.62, 0])
. stroke{BLUE, 4} Line(start: [0.45, -1.1, 0], end: [0.45, -0.82, 0])
. stroke{BLUE, 4} Line(start: [1.4, -1.1, 0], end: [1.4, -0.94, 0])
. color{WHITE} center{[0, 1.35, 0]} Text("a shape becomes amplitudes", 0.88)
. color{GRAY} center{[0, -1.55, 0]} Text("frequency", 0.78)
}
"spectrum"
play Fade(0.6)Corners cost high frequencies
Smoothness and frequency content are linked. A very smooth function has Fourier coefficients that decay quickly. A function with a corner needs more high-frequency content. A function with a jump needs even more.
This explains why compression works. If an image or sound has lots of smooth structure, many high-frequency coefficients are small. You can throw away the tiny ones and keep the perceptually important part. But sharp edges, clicks, and sudden transitions are expensive. They demand high frequencies.
It also explains a subtle visual feature near jumps: the partial sums overshoot. Even with many terms, the Fourier approximation has a little ripple near a discontinuity. This is the Gibbs phenomenon. The overshoot does not vanish in height, but it gets squeezed into a narrower region.
A new coordinate system
The deepest lesson is not that sine waves are useful. It is that the same object can become simpler when expressed in the right coordinates.
In position space, a square wave is a simple instruction with a sharp jump. In frequency space, it is an infinite list of odd harmonics. In the heat equation, position space says neighboring points average with one another. Frequency space says each sine wave decays independently.
Fourier analysis is the bridge between those descriptions. It turns geometry into sound and differential equations into multiplication. Once you learn to hear a shape, many hard problems become questions about which frequencies are present and how strongly they speak.