
Monocurl Essays
Series Download

Thinking at the margin: marginal cost and revenue

The right question is what one more unit adds to revenue and to cost. Why averages mislead, why sunk costs drop out, and why profit peaks where MR meets MC.

20 min·High school and early college·

AssumesSupply and demand: where a price comes fromElasticity: when raising the price lowers revenue

A cake stall’s revenue (blue) and cost (orange) for 0 to 6 cakes a day. The bar between them is the profit: red when cost is larger, green when revenue is. It is tallest at four cakes, where profit is $100.
Monocurl source
let FH = Frame(0, 6, 0, 260, [-0.95, 0.15, 0], 4.3, 2.9)
let val = |xs, q| {
    let i = to_int(clamp(0, floor(q), 5))
    return lerp(xs[i], xs[i + 1], q - i)
}
let Gap = |q| {
    let r = val(TR, q)
    let c = val(TC, q)
    var col = LEAF
    if (r < c) { col = ROSE }
    # the readout shows whole cakes only, with the profit that belongs to that number
    let k = to_int(round(q))
    var kcol = LEAF
    if (TR[k] < TC[k]) { kcol = ROSE }
    return [
        Seg(at(FH, q, c), at(FH, q, r + 0.01), col, 8),
        Pt(at(FH, q, r), AZURE, 0.09),
        Pt(at(FH, q, c), EMBER, 0.09),
        center{[2.7, 1.12, 0]} scale{1.25} color{INK} Number(k, 0),
        center{[2.7, 0.02, 0]} scale{1.25} color{kcol} Number(TR[k] - TC[k], 0)
    ]
}
mesh plot = Plot(FH, [1, 2, 3, 4, 5, 6], [50, 100, 150, 200, 250], "cakes made in a day", "dollars per day", 0.85, 0.42, [2, 4, 6])
mesh curves = [
    Path(map(range(0, 7), |k| at(FH, k, TR[k])), AZURE, 4),
    Path(map(range(0, 7), |k| at(FH, k, TC[k])), EMBER, 4)
]
mesh words = [
    center{[2.7, 1.55, 0]} Note("cakes", 0.74),
    center{[2.7, 0.45, 0]} Note("profit ($)", 0.74),
    center{[2.7, -0.75, 0]} Cap("revenue", 0.74, AZURE),
    center{[2.7, -1.15, 0]} Cap("cost", 0.74, EMBER)
]
mesh gap = Gap(q: 0)

slide "climb"
    play Wait(0.7)
    gap.q = 1
    play Lerp(0.6, [&gap])
    play Wait(0.3)
    gap.q = 2
    play Lerp(0.6, [&gap])
    play Wait(0.3)
    gap.q = 3
    play Lerp(0.6, [&gap])
    play Wait(0.3)
    gap.q = 4
    play Lerp(0.6, [&gap])
    play Wait(0.3)
    gap.q = 5
    play Lerp(0.6, [&gap])
    play Wait(0.3)
    gap.q = 6
    play Lerp(0.6, [&gap])
    play Wait(0.5)
    gap.q = 4
    play Lerp(1.2, [&gap])
    play Wait(1.8)

Uses the shared definitions for this lesson's figures.

A flight with 150 seats costs an airline $30,000 to operate, which is $200 a seat. Ten minutes before the door closes there are ten empty seats, and a standby passenger offers $80 for one of them. Selling a $200 seat for $80 looks like a way to lose $120. The airline sells it, and the airline is right.

The $200 figure answers the question “what did a seat cost on average?” The decision at the gate needs the answer to a different question: what changes if this one passenger boards? The crew, the fuel for the aircraft’s own weight and the landing fee are paid whether or not seat 23C is occupied. Suppose one more passenger adds $15 of fuel, catering and card fees. Then boarding the passenger adds $80 of revenue and $15 of cost, and the airline ends the day $65 richer than if the seat had flown empty.

Average cost and marginal cost answer different questions

Write $C(q)$ for the total cost of serving $q$ units, here passengers. For the flight, $C(q) = 30000 + 15q$ dollars.

With 140 seats sold, the average cost is $AC(140) = 30000/140 + 15 \approx 229$ dollars. The marginal cost of the 141st passenger is $C(141) - C(140) = 15$ dollars. Both are honest numbers. Only the second describes what the decision at the gate changes.
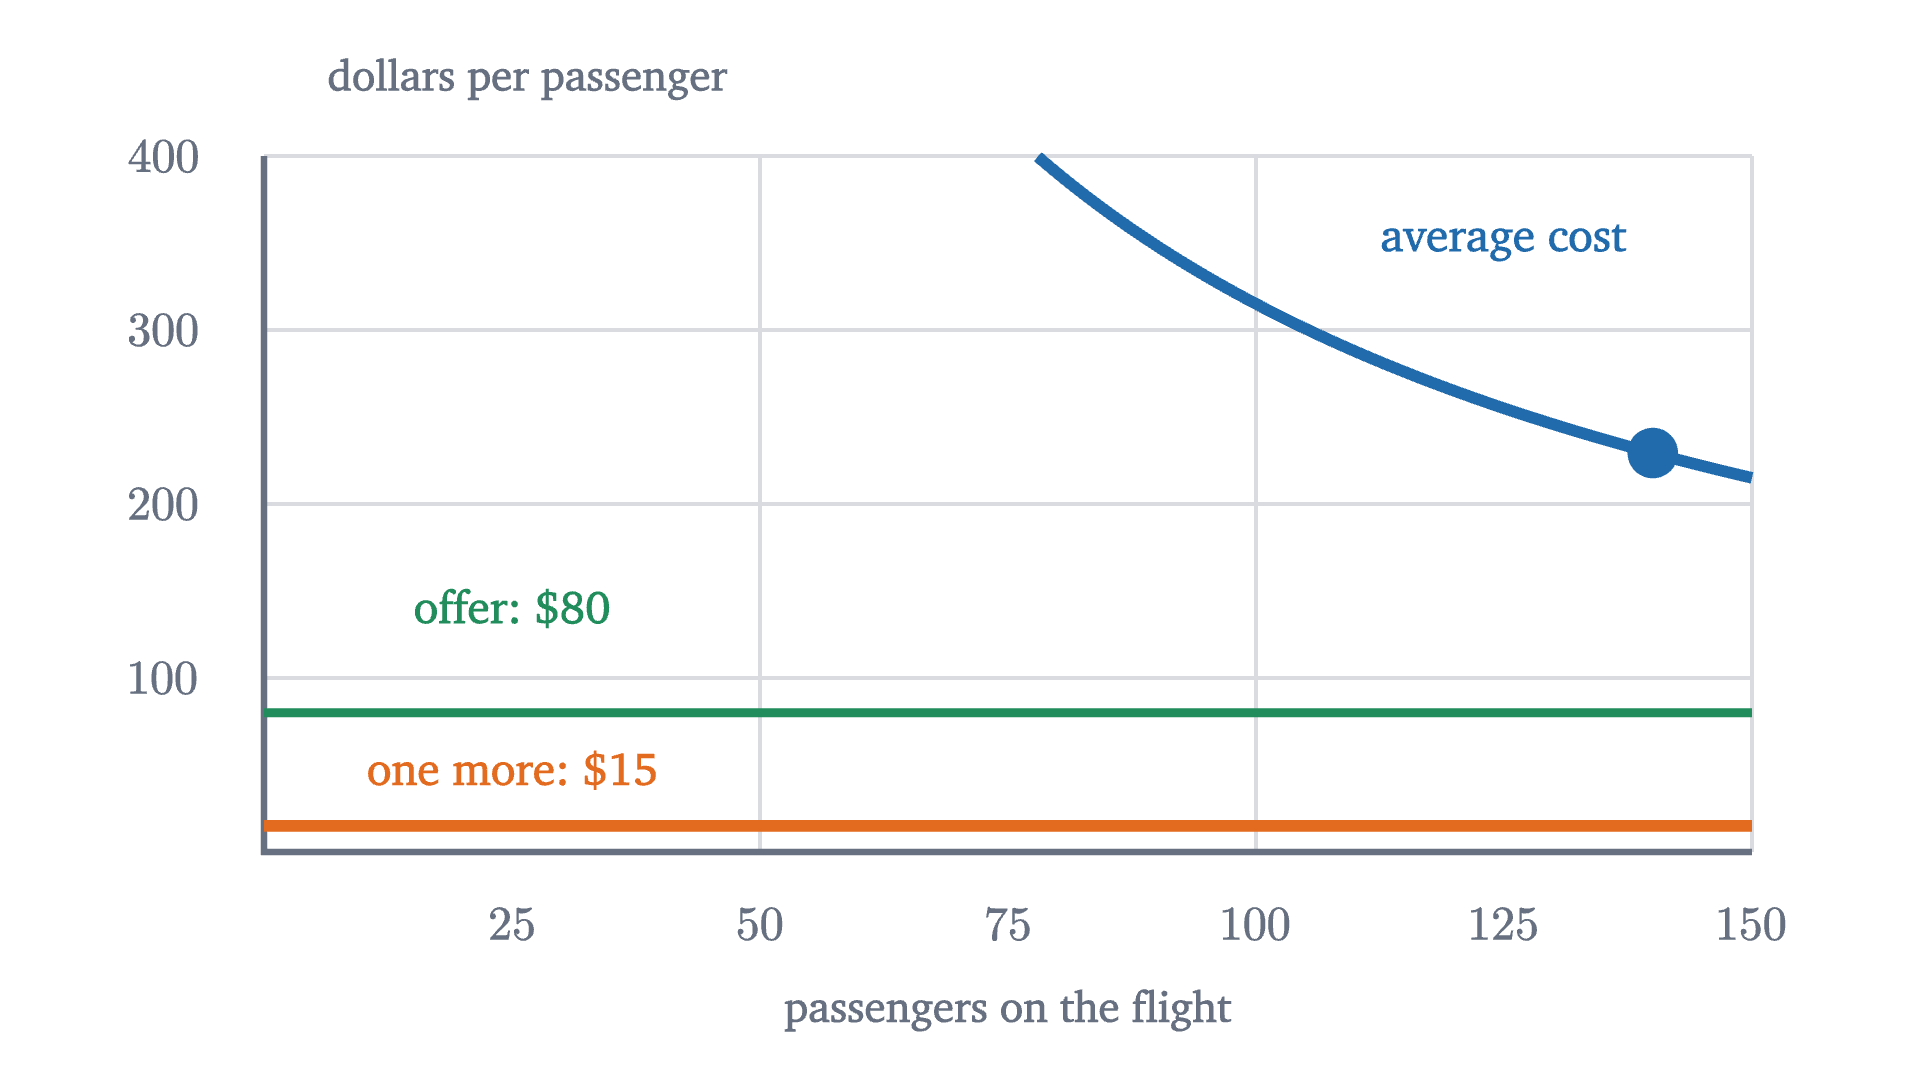
The flight's average cost per passenger falls as more seats fill, but stays above $200. The cost of carrying one more passenger is $15 throughout. A standby offer of $80 is far below the average cost and far above the cost it causes.
The flight’s average cost per passenger falls as more seats fill, but stays above $200. The cost of carrying one more passenger is $15 throughout. A standby offer of $80 is far below the average cost and far above the cost it causes.
Monocurl source
let FA = Frame(0, 150, 0, 400, [0.2, 0.15, 0], 6.2, 2.9)
mesh plot = Plot(FA, [25, 50, 75, 100, 125, 150], [100, 200, 300, 400], "passengers on the flight", "dollars per passenger", 1.1, 0.42, [50, 100, 150])
mesh lines = [
    stroke{AZURE, 4.5} Polyline(map(sample(78, 150, 60), |n| at(FA, n, 30000 / n + 15))),
    Seg(at(FA, 0, 80), at(FA, 150, 80), LEAF, 3.5),
    Seg(at(FA, 0, 15), at(FA, 150, 15), EMBER, 4.5),
    Pt(at(FA, 140, 30000 / 140 + 15), AZURE, 0.1)
]
mesh labels = [
    center{at(FA, 125, 350)} Cap("average cost", 0.76, AZURE),
    center{at(FA, 25, 140)} Cap("offer: $80", 0.76, LEAF),
    center{at(FA, 25, 47)} Cap("one more: $15", 0.76, EMBER)
]

Uses the shared definitions for this lesson's figures.

The two numbers are linked, and the link explains the graph. If the next unit costs less than the average so far, it pulls the average down, the way a low test score pulls down a grade average.

On the flight the marginal cost of $15 is always below the average, so every extra passenger lowers the average and none of them ever brings it down to $15.

Sunk costs

The $30,000 dropped out of the gate decision for a specific reason: by then it could not be changed.

A sunk cost appears in the result of every available option. When two options are compared by subtracting one result from the other, it cancels. With the standby passenger the day’s result is $R + 80 - 30000 - 15 \times 141$, without her it is $R - 30000 - 15 \times 140$, and the difference is $80 - 15 = 65$ whatever the $30,000 was.

“Fixed” and “sunk” are different properties. A fixed cost does not vary with quantity; a sunk cost can no longer be avoided at all. A week before departure the $30,000 is fixed but not yet sunk, because the flight could still be canceled.

Pause and try

(a) At the gate, a tour group offers $50 a seat for all ten empty seats. Accept? (b) A week earlier, only 60 seats are booked, at an average fare of $250, no more bookings are expected, and canceling would avoid the entire $30,000. Ignoring the cost of rebooking passengers, should the flight operate?

Show answerHide answer

(a) Each seat adds $50 of revenue and $15 of cost, so accepting adds $10 \times 35 = 350$ dollars. Accept, although $50 is a quarter of the average cost. (b) Now the $30,000 is avoidable, so it counts. Operating brings in $60 \times 250 = 15000$ dollars and costs $30000 + 15 \times 60 = 30900$. Canceling is better by $15,900. The same $30,000 is ignored in (a) and decisive in (b), because only in (b) does the choice affect it.

How many to make

The airline’s question was about one unit. Most decisions are about how many. Mara sells large decorated cakes from a market stall. The stall fee is $60 a day, paid in advance. Through experience she knows her demand: to sell $Q$ cakes in a day she can charge at most $P = 100 - 10Q$ dollars each. She charges every customer the same price, and she bakes to order, so nothing is wasted. She also knows her costs. She wants the largest profit.

Cakes $q$PriceRevenue $R(q)$Cost $C(q)$Profit
0060$-60$
190908010
2801609565
37021011595
460240140100
55025018565
640240250$-10$

Reading down the last column, the best plan is four cakes at $60 each, for a profit of $100. That settles this case. But the table hides why four is the answer, and it has to be rebuilt whenever anything changes. So ask the airline’s question once per cake.

Pause and try

Compute $MR(q)$ and $MC(q)$ for cakes 1 through 6 from the table. The fourth cake sells for $60. Why is its marginal revenue not $60?

Show answerHide answer

$MR$: 90, 70, 50, 30, 10, $-10$. $MC$: 20, 15, 20, 25, 45, 65. To sell a fourth cake Mara must lower the price from $70 to $60 for every customer. She gains $60 from the fourth cake and gives up $10 on each of the three she would have sold anyway: $60 - 30 = 30$. These are the two strips from the lesson on elasticity.

  1. The first cake adds 90 dollars of revenue and 20 of cost. Profit goes from a loss of 60 to a gain of 10.
  2. The second and third each add more revenue than cost. Profit rises to 65, then to 95.
  3. The fourth adds 30 of revenue and 25 of cost. It is still worth baking, and profit reaches 100.
  4. The fifth would add 10 of revenue and 45 of cost, cutting profit to 65. Stop at four.
Mara’s decision one cake at a time. For each cake the blue bar is the revenue it adds and the orange bar is the cost it adds. Profit rises while blue is taller and falls once orange is.
Monocurl source
let Pair = |k| [
    Bar(FB, k - 0.36, k - 0.02, MRv(k), tint(AZURE, 0.6)),
    Bar(FB, k + 0.02, k + 0.36, MCv(k), tint(EMBER, 0.6))
]
let Side = |k, col| [
    Read(1.55, "adds to revenue", to_string(MRv(k), 0), AZURE),
    Read(0.5, "adds to cost", to_string(MCv(k), 0), EMBER),
    Read(-0.55, "profit ($)", to_string(TR[k] - TC[k], 0), col)
]
mesh bars = []
mesh plot = BarPlot(FB, [20, 40, 60, 80, 100], "dollars per cake")
mesh side = []

slide "The first cake adds 90 dollars of revenue and 20 of cost. Profit goes from a loss of 60 to a gain of 10."
    bars = [Pair(1)]
    side = Side(1, LEAF)
    play Fade(0.6)

slide "The second and third each add more revenue than cost. Profit rises to 65, then to 95."
    side = []
    play Fade(0.3, [&side])
    bars = [Pair(1), Pair(2), Pair(3)]
    side = Side(3, LEAF)
    play Fade(0.6)

slide "The fourth adds 30 of revenue and 25 of cost. It is still worth baking, and profit reaches 100."
    side = []
    play Fade(0.3, [&side])
    bars = [Pair(1), Pair(2), Pair(3), Pair(4)]
    side = Side(4, LEAF)
    play Fade(0.6)

slide "The fifth would add 10 of revenue and 45 of cost, cutting profit to 65. Stop at four."
    side = []
    play Fade(0.3, [&side])
    bars = [Pair(1), Pair(2), Pair(3), Pair(4), Pair(5)]
    side = Side(5, ROSE)
    play Fade(0.6)

Uses the shared definitions for this lesson's figures.

Each cake changes profit by its marginal revenue minus its marginal cost: $+70$, $+55$, $+30$, $+5$, then $-35$ and $-75$. Starting from $-60$ and adding these up reproduces the profit column. The best quantity is where the additions stop being positive.

The hypothesis in part 2, one switch from “revenue bar taller” to “cost bar taller”, holds whenever $MR(k) - MC(k)$ decreases as $k$ grows. That is the usual case: selling more requires a lower price, and producing more eventually strains capacity. When it fails, part 1 still holds, and we will meet such a case below. If some unit has $MR(k) = MC(k)$ exactly, it leaves profit unchanged and both $k - 1$ and $k$ are best. When quantity varies continuously the switch always passes through such a point of equality, which is why the rule is quoted as “$MR = MC$”.

Two rules of thumb that use averages fail on Mara’s table. “Bake while the price exceeds average cost” keeps going to five cakes, where the price of $50 is above $AC(5) = 37$; five cakes do make a profit, but $35 less than four. “Make the quantity with the lowest average cost” picks four here, but only by coincidence: it ignores demand entirely.
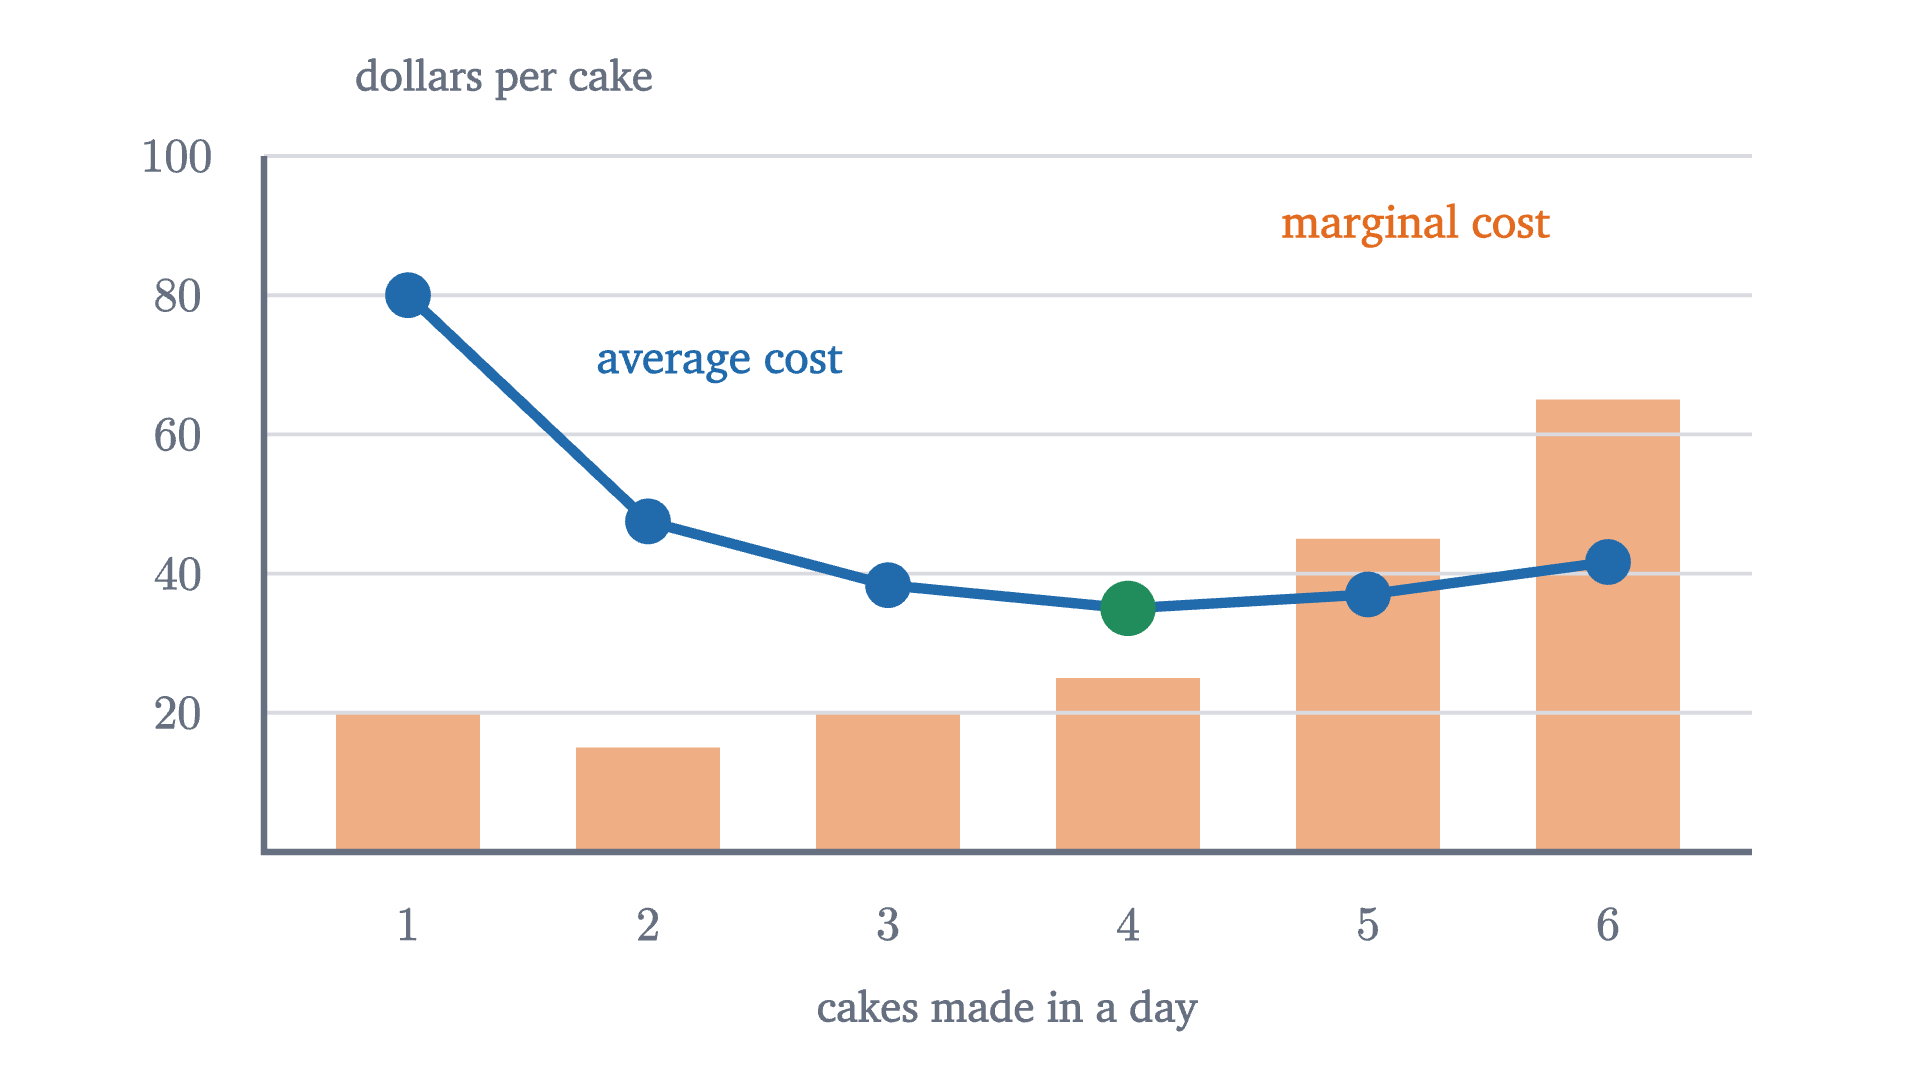
Mara's marginal cost (bars) and average cost (line) for each cake. While a bar is below the line the average falls, and once the bars rise above it the average rises, so the average is lowest, $35, at four cakes.
Mara’s marginal cost (bars) and average cost (line) for each cake. While a bar is below the line the average falls, and once the bars rise above it the average rises, so the average is lowest, $35, at four cakes.
Monocurl source
let FAC = Frame(0.4, 6.6, 0, 100, [0.2, 0.15, 0], 6.2, 2.9)
mesh bars = map(range(1, 7), |k| Bar(FAC, k - 0.3, k + 0.3, MCv(k), tint(EMBER, 0.55)))
mesh plot = Plot(FAC, [1, 2, 3, 4, 5, 6], [20, 40, 60, 80, 100], "cakes made in a day", "dollars per cake", 1.0, 0.36, [])
mesh avg = [
    Path(map(range(1, 7), |k| at(FAC, k, TC[k] / k)), AZURE, 4),
    map(range(1, 7), |k| Pt(at(FAC, k, TC[k] / k), AZURE, 0.09)),
    Pt(at(FAC, 4, 35), LEAF, 0.11)
]
mesh labels = [
    center{at(FAC, 2.3, 70)} Cap("average cost", 0.76, AZURE),
    center{at(FAC, 5.2, 90)} Cap("marginal cost", 0.76, EMBER)
]

Uses the shared definitions for this lesson's figures.

The picture is the average-marginal theorem at work: $MC(4) = 25 < AC(3) \approx 38.3$, so the average falls to 35, and $MC(5) = 45 > AC(4) = 35$, so it rises to 37.

The stall fee plays no part in the quantity decision. It sits in $\pi(0) = -60$, the starting point of the sum in part 1, and in none of the terms.
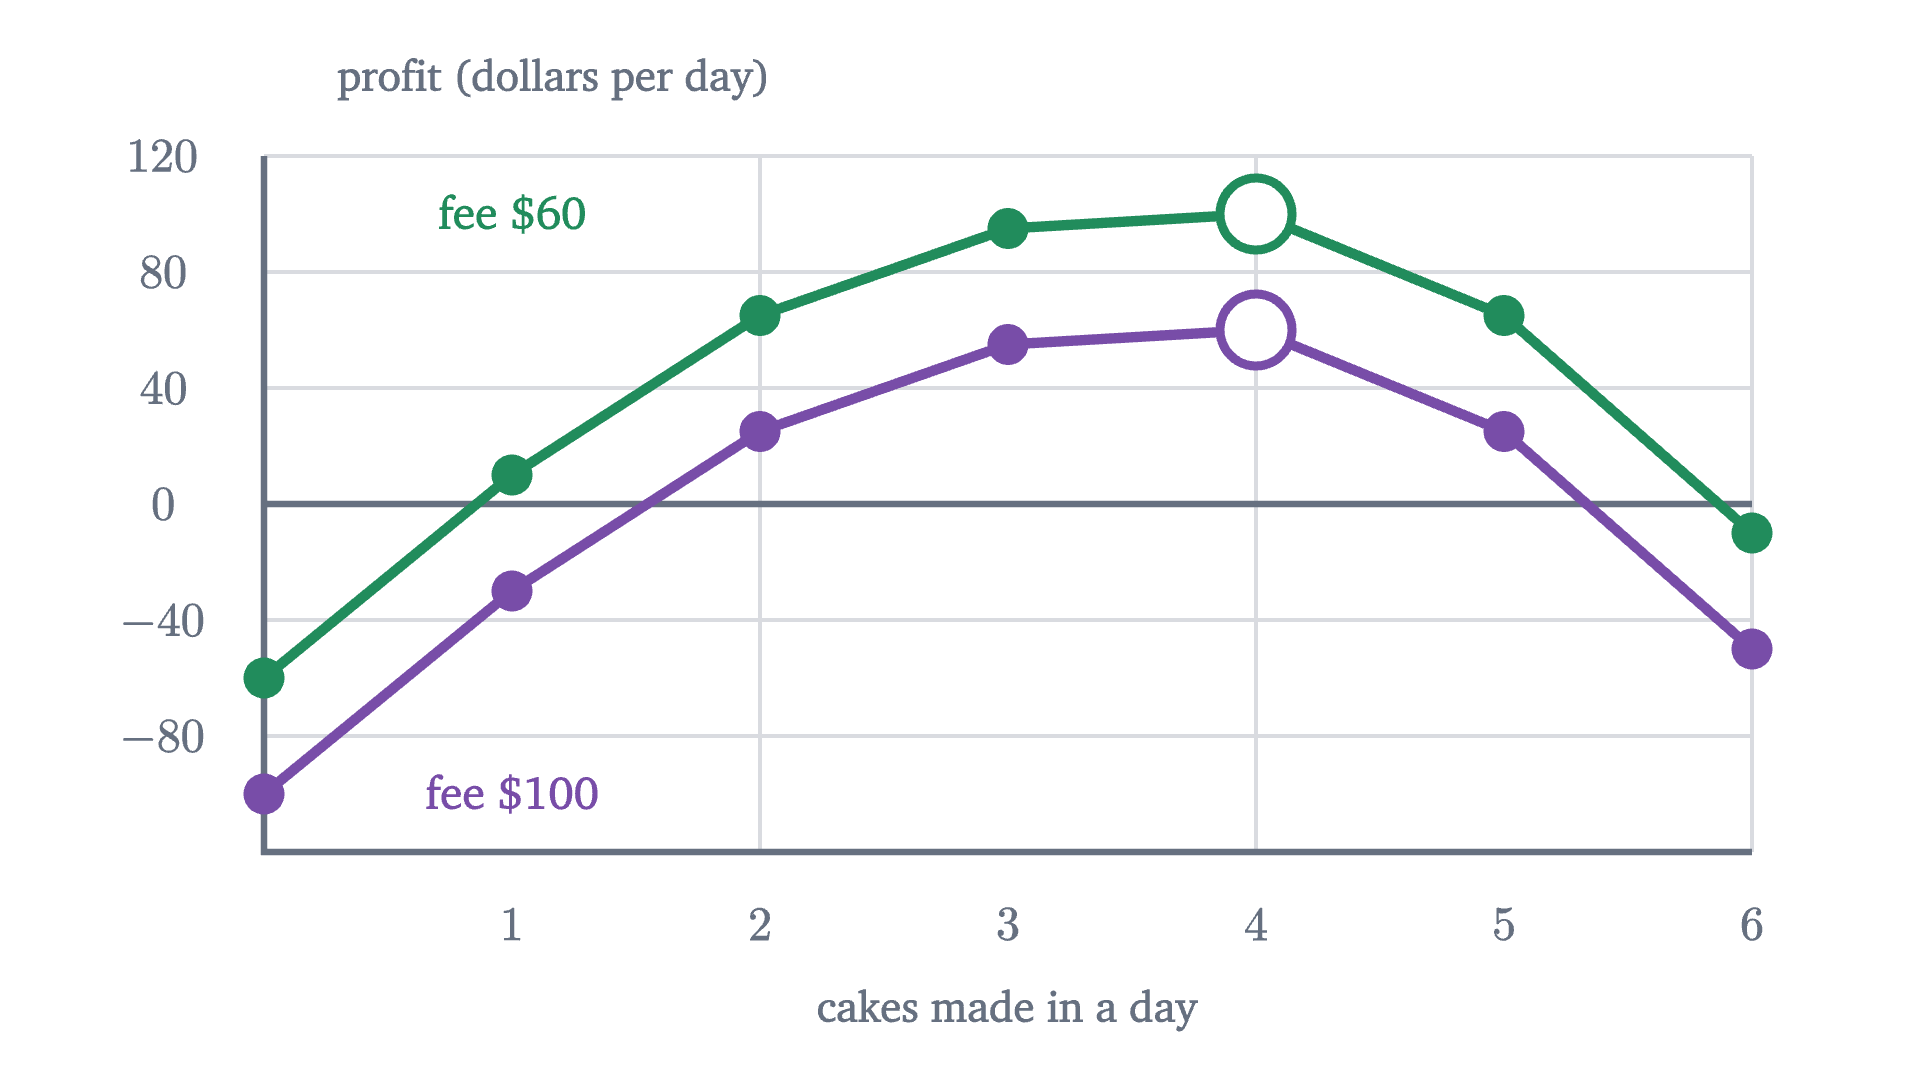
Mara's profit for each number of cakes when the stall fee is $60 (green) and when it is $100 (purple). The fee moves every point down by the same amount, so the best quantity is four in both cases.
Mara’s profit for each number of cakes when the stall fee is $60 (green) and when it is $100 (purple). The fee moves every point down by the same amount, so the best quantity is four in both cases.
Monocurl source
let FP = Frame(0, 6, -120, 120, [0.2, 0.15, 0], 6.2, 2.9)
let Hill = |fee, col| [
    Path(map(range(0, 7), |k| at(FP, k, TR[k] - TC[k] + 60 - fee)), col, 4),
    map(range(0, 7), |k| Pt(at(FP, k, TR[k] - TC[k] + 60 - fee), col, 0.08)),
    Ring(at(FP, 4, 160 - fee), col, 0.15, 3.5)
]
mesh plot = [
    Plot(FP, [1, 2, 3, 4, 5, 6], [-80, -40, 0, 40, 80, 120], "cakes made in a day", "profit (dollars per day)", 1.2, 0.42, [2, 4, 6]),
    Seg(at(FP, 0, 0), at(FP, 6, 0), SLATE, 2.5)
]
mesh hills = [Hill(100, PLUM), Hill(60, LEAF)]
mesh labels = [
    center{at(FP, 1, 100)} Cap("fee $60", 0.76, LEAF),
    center{at(FP, 1, -100)} Cap("fee $100", 0.76, PLUM)
]

Uses the shared definitions for this lesson's figures.

The same rule with calculus (optional)

If quantity can vary continuously, say cake sold by the kilogram, the differences become derivatives. Take $R(q) = 100q - 10q^2$ and $C(q) = 60 + 10q + 5q^2$. Marginal revenue is $R'(q) = 100 - 20q$ and marginal cost is $C'(q) = 10 + 10q$. Profit $\pi = R - C$ has $\pi'(q) = R'(q) - C'(q) = 90 - 30q$, which is zero at $q = 3$, and since $\pi''(q) = -30 < 0$ this is a maximum, by the reasoning in the lesson on optimization. There $R'(3) = C'(3) = 40$ and $\pi(3) = 210 - 135 = 75$.
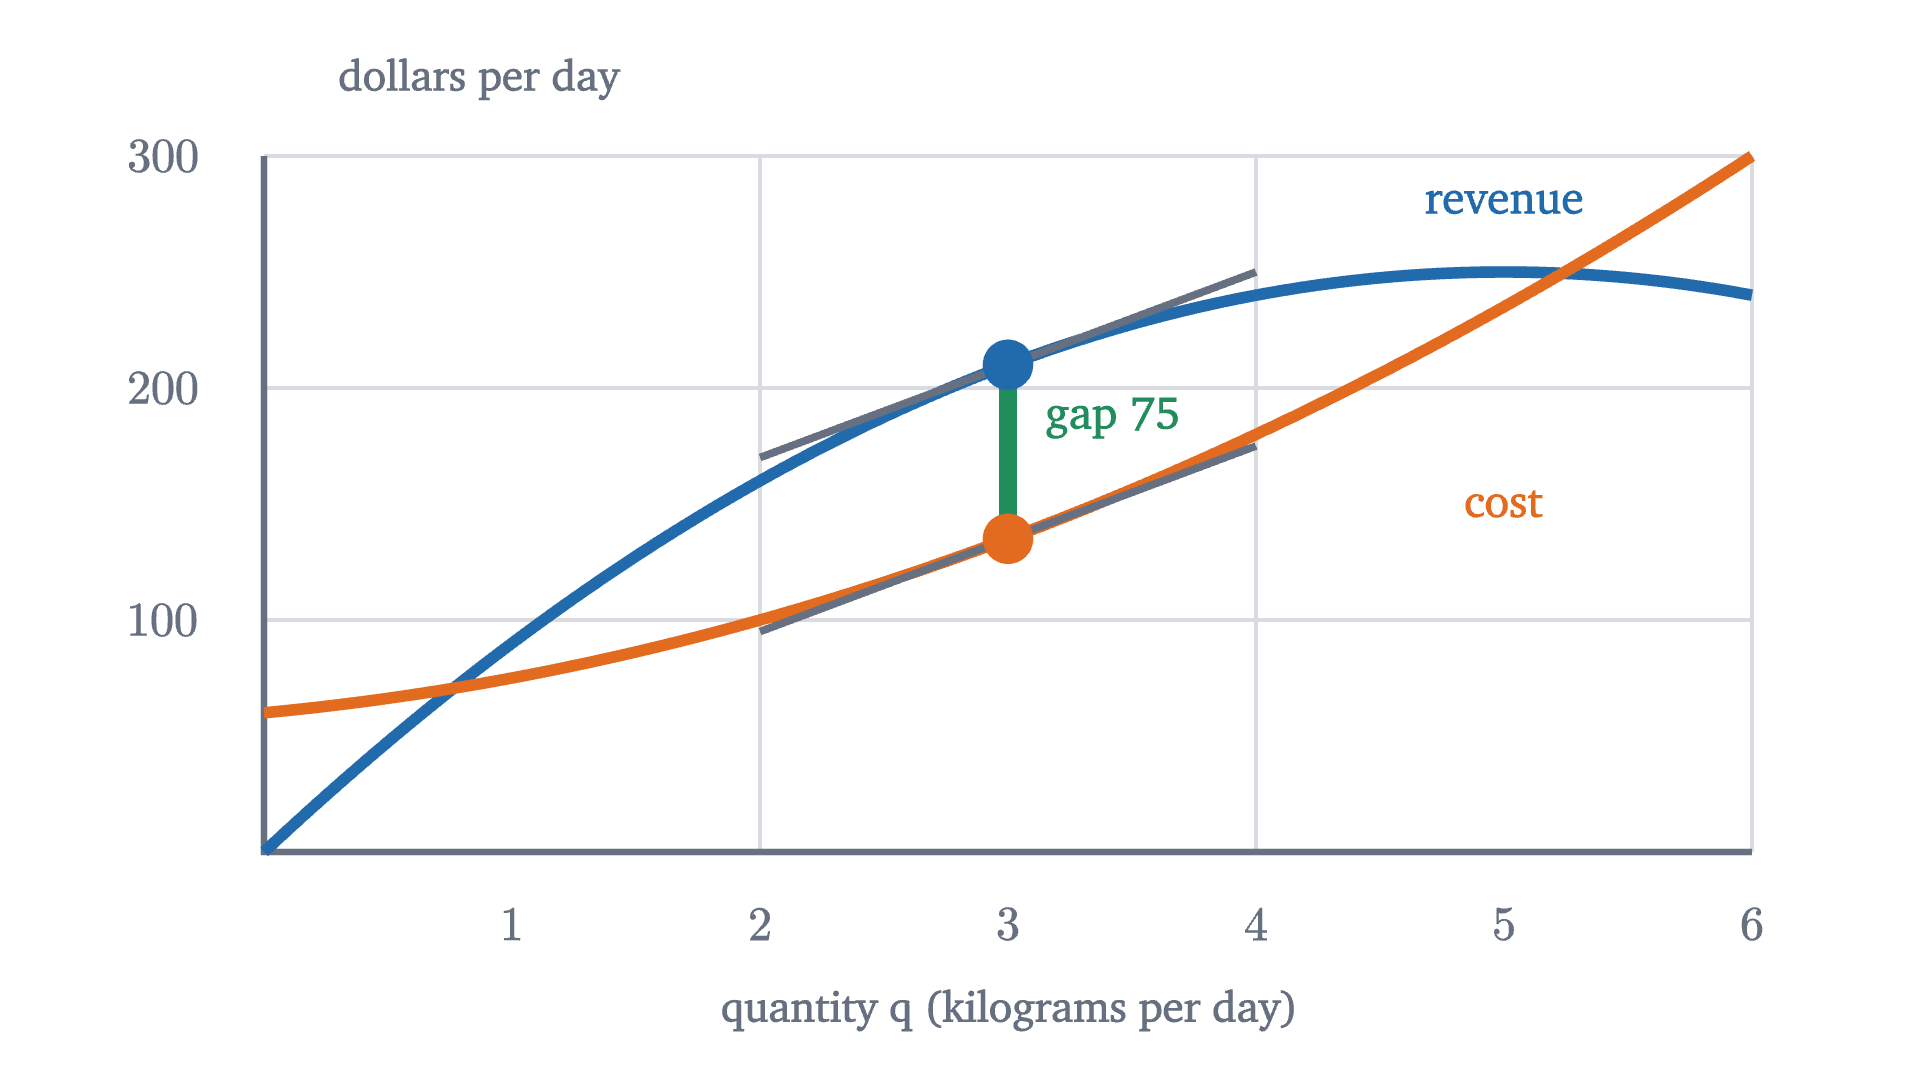
Smooth revenue and cost curves. The profit is the vertical gap between them. It is widest at q = 3, where the two tangent lines are parallel: revenue and cost are growing at the same rate, $40 per unit.
Smooth revenue and cost curves. The profit is the vertical gap between them. It is widest at $q = 3$, where the two tangent lines are parallel: revenue and cost are growing at the same rate, $40 per unit.
Monocurl source
let FS = Frame(0, 6, 0, 300, [0.2, 0.15, 0], 6.2, 2.9)
let rev = |q| 100 * q - 10 * q * q
let cost = |q| 60 + 10 * q + 5 * q * q
mesh plot = Plot(FS, [1, 2, 3, 4, 5, 6], [100, 200, 300], "quantity q (kilograms per day)", "dollars per day", 0.9, 0.42, [2, 4, 6])
mesh curves = [
    Graph(FS, rev, 0, 6, AZURE, 4.5),
    Graph(FS, cost, 0, 6, EMBER, 4.5)
]
mesh marks = [
    Seg(at(FS, 3, cost(3)), at(FS, 3, rev(3)), LEAF, 7),
    Seg(at(FS, 2, rev(3) - 40), at(FS, 4, rev(3) + 40), SLATE, 3),
    Seg(at(FS, 2, cost(3) - 40), at(FS, 4, cost(3) + 40), SLATE, 3),
    Pt(at(FS, 3, rev(3)), AZURE, 0.1),
    Pt(at(FS, 3, cost(3)), EMBER, 0.1)
]
mesh labels = [
    center{at(FS, 5, 280)} Cap("revenue", 0.76, AZURE),
    center{at(FS, 5, 150)} Cap("cost", 0.76, EMBER),
    center{at(FS, 3.42, 187)} Cap("gap 75", 0.76, LEAF)
]

Uses the shared definitions for this lesson's figures.

The condition $R'(q) = C'(q)$ alone is not enough, for the same reason as in the discrete theorem: it also holds where profit is smallest, if marginal cost crosses marginal revenue from above.

A seller who cannot choose the price

Mara had a demand curve of her own. Many sellers do not. A farmer selling wheat, or one of the students selling a used textbook in the lesson on supply and demand, faces a going price that her own quantity is too small to move.

For a price-taker the marginal rule reads: produce every unit whose marginal cost is at most the price. When marginal cost is rising, production stops where $MC$ reaches $p$, which is the textbook condition $P = MC$. This is also where a supply curve comes from. In the supply-and-demand lesson each seller had a “cost”, the lowest price she would accept, and the supply curve was those costs in increasing order. That cost is a marginal cost.

Suppose Mara switches to plain cakes that a supermarket buys at a fixed price, in any number, and her costs are the same as before.

  1. At a price of 40 dollars, the first four cakes each cost less than they bring in. Revenue 160, total cost 140, profit 20.
  2. At 30 dollars she still bakes four. Revenue of 120 covers the variable cost of 80 but not the fee as well: a loss of 20.
  3. At 17 dollars the best she could do is two cakes, which bring in 34 and cost 35. No quantity covers its variable cost, so she bakes nothing.
Mara as a price-taker. Bars are the marginal cost of each cake and the blue line is the market price. She bakes the cakes whose bars lie below the line, as long as the revenue covers the variable cost.
Monocurl source
let FT = Frame(0.4, 6.6, 0, 80, [-0.95, 0.15, 0], 4.3, 2.9)
let Costs = |n| map(range(1, 7), |k| Bar(FT, k - 0.3, k + 0.3, MCv(k), tint(EMBER, 0.25 + 0.5 * (k <= n))))
let Line = |p| [
    Seg(at(FT, 0.4, p), at(FT, 6.6, p), AZURE, 4)
]
let Tally = |p, n| [
    Read(1.55, "price ($)", to_string(p, 0), AZURE),
    Read(0.5, "revenue", to_string(p * n, 0)),
    Read(-0.55, "variable cost", to_string(TC[n] - 60, 0), EMBER)
]
mesh bars = Costs(0)
mesh plot = Plot(FT, [1, 2, 3, 4, 5, 6], [20, 40, 60, 80], "which cake of the day", "dollars per cake", 1.0, 0.36, [])
mesh line = []
mesh side = []

slide "At a price of 40 dollars, the first four cakes each cost less than they bring in. Revenue 160, total cost 140, profit 20."
    bars = Costs(4)
    line = Line(p: 40)
    side = Tally(40, 4)
    play Fade(0.6)

slide "At 30 dollars she still bakes four. Revenue of 120 covers the variable cost of 80 but not the fee as well: a loss of 20."
    side = []
    play Fade(0.3, [&side])
    line.p = 30
    play Lerp(1.4, [&line])
    side = Tally(30, 4)
    play Fade(0.4, [&side])

slide "At 17 dollars the best she could do is two cakes, which bring in 34 and cost 35. No quantity covers its variable cost, so she bakes nothing."
    side = []
    play Fade(0.3, [&side])
    line.p = 17
    bars = Costs(0)
    play Lerp(1.4, [&line])
    play Fade(0.4, [&bars])
    side = Tally(17, 2)
    play Fade(0.4, [&side])

Uses the shared definitions for this lesson's figures.

At $40 the rule gives four cakes and a profit of $160 - 140 = 20$ dollars. At $30 it still gives four, since $MC(4) = 25 \le 30 < MC(5) = 45$, but now revenue is 120 against a cost of 140. She loses $20. Should she stay home?

Pause and try

The $60 stall fee is paid in advance and is not refundable. At a price of $30, compare Mara’s result from baking four cakes with her result from baking none. What must revenue cover for baking to be worthwhile?

Show answerHide answer

Baking four: $120 - 140 = -20$. Baking none: $0 - 60 = -60$. Baking is better by $40, which is revenue of 120 minus the variable cost of 80. The fee is sunk, so it appears in both results and cancels. Baking is worthwhile exactly when revenue covers the variable cost.

In symbols, with a sunk fixed cost $F$ and variable cost $V(q)$: producing $q \ge 1$ units beats producing none exactly when $pq - V(q) - F \ge -F$, that is, when $p \ge V(q)/q$. The right side is the average variable cost, $AVC(q)$. So a price-taker should shut down when the price is below the smallest value of $AVC$, and otherwise produce where the marginal rule says.

If the fee is not sunk, as when Mara is deciding whether to rent the stall next season, it counts, and the test becomes whether revenue covers all costs: $p \ge AC(q)$. Her lowest average cost is $35. So at prices between $17.50 and $35 she operates today at a loss and does not renew.

What the model assumes

The rule is a theorem about a seller who knows her revenue and cost schedules and wants maximum profit. Whether real firms behave this way is an empirical matter. Surveys since the 1930s have found many managers describing their pricing as a markup on average cost, while airline pricing systems are built on marginal reasoning of the kind in the opening. The airline example also leaned on an assumption: that the $80 fare did not lower anyone else’s fare. If regular customers learn to wait for last-minute bargains, the marginal revenue of the cheap seat is less than $80, and the calculation has to include that.

Check yourself

A factory’s lease costs $10,000 a month and is paid for the year. This month it can make 500 chairs at a variable cost of $30 each and sell them for $40 each. What should it do?

All of this came from one habit: compare the options that are open, and count only what differs between them. The average cost of a seat, the fee already paid and the money already spent on a ticket are the same on every branch, so they cancel. The next lesson uses marginal cost as the supply curve to ask how much buyers and sellers gain from a market, and what a tax does to that gain.

Problems

The first three repeat the lesson’s calculations, the next three ask you to apply the ideas, and the last two extend them.

Problem 1

A lemonade stand’s revenue for $q = 0, \dots, 5$ jugs is 0, 50, 90, 120, 140, 150 dollars and its cost is 30, 50, 65, 85, 115, 155 dollars. Compute $MR$ and $MC$ for each jug, find the best quantity with the marginal rule, and confirm it with the profits.

Show solutionHide solution

$MR$: 50, 40, 30, 20, 10. $MC$: 20, 15, 20, 30, 40. $MR - MC$: $30, 25, 10, -10, -30$. The sign switches once, after the third jug, so $q^* = 3$. Profits: $-30, 0, 25, 35, 25, -5$. The largest is 35, at three jugs, and each profit is the previous one plus $MR - MC$.

Problem 2

A train run costs $12,000 plus $5 per passenger. With 160 tickets sold, find the average cost per passenger and the marginal cost of one more. A last-minute traveler offers $40. Should the operator accept, and what happens to the average cost?

Show solutionHide solution

$AC(160) = 12000/160 + 5 = 80$ dollars, and $MC(161) = 5$ dollars. Accepting adds $40 of revenue and $5 of cost, a gain of $35, so accept. Since $MC(161) = 5 < AC(160) = 80$, the average falls: by the theorem, by $(80 - 5)/161 \approx 0.47$ dollars, to about $79.53.

Problem 3

The lemonade stand of the first problem becomes a price-taker at $25 a jug, with the same costs. The $30 fixed cost is sunk. How many jugs should it make, and what is its profit? Should it shut down?

Show solutionHide solution

Marginal costs are 20, 15, 20, 30, 40. The jugs with $MC \le 25$ are the first three, and the difference $25 - MC$ switches sign once, so make three. Revenue is 75 and cost is 85, a loss of $10. Variable cost is $85 - 30 = 55$, which revenue covers, so operating (losing 10) beats shutting down (losing 30). In terms of averages: $AVC(3) = 55/3 \approx 18.3 < 25$.

Problem 4

You paid $60 for a concert ticket that cannot be refunded. On the night you are tired: you would now value attending at $30, and a friend offers a dinner you value at $45. (a) What should you do? (b) What if you learn that you can resell the ticket for $50?

Show solutionHide solution

(a) The $60 is sunk and appears in both options. Attending is worth 30 and the dinner is worth 45, so go to dinner. Counting the $60 as a reason to attend is the sunk cost fallacy. (b) Now $50 of the ticket’s cost is recoverable, so it is no longer sunk. The options are: attend, worth 30; or sell and dine, worth $50 + 45 = 95$. Sell. Attending now has an opportunity cost of $50 that it did not have in (a).

Problem 5

Mara’s landlord replaces the $60 daily fee with a charge of $20 per cake sold. Use the original table, where she sets her own price. How many cakes does she now make, and does she prefer the old arrangement?

Show solutionHide solution

The fixed cost is now 0 and every marginal cost rises by 20, to 40, 35, 40, 45, 65, 85. Marginal revenue is 90, 70, 50, 30, 10, $-10$, so $MR - MC$ is $50, 35, 10, -15, \dots$ and the best quantity is three. Variable costs before the charge are 20, 35, 55 for one to three cakes, so profit at three is $210 - 55 - 60 = 95$. Under the old fee she made four cakes and $100. She slightly prefers the old arrangement, and the landlord collects $60 either way. A per-unit charge changes the quantity; a fixed fee does not.

Problem 6

A student has an average of 80 on four tests and scores 70 on the fifth. Find the new average using the average-marginal formula. Then prove: if $AC(q) \le AC(q-1)$ and $AC(q) \le AC(q+1)$, so that average cost is lowest at $q$, then $MC(q) \le AC(q) \le MC(q+1)$.

Show solutionHide solution

The fifth score plays the role of the marginal value: the new average is $80 + (70 - 80)/5 = 78$. For the proof, apply the theorem twice. From $AC(q) - AC(q-1) = \frac{MC(q) - AC(q-1)}{q} \le 0$ we get $MC(q) \le AC(q-1)$. Rewrite the same identity as $q\,AC(q) = (q-1)\,AC(q-1) + MC(q)$; since $AC(q-1) \ge AC(q)$, this gives $q\,AC(q) \ge (q-1)\,AC(q) + MC(q)$, so $MC(q) \le AC(q)$. From $AC(q+1) - AC(q) = \frac{MC(q+1) - AC(q)}{q+1} \ge 0$ we get $MC(q+1) \ge AC(q)$. So marginal cost passes from below average cost to above it at the quantity where average cost is lowest, as in the figure, where $25 \le 35 \le 45$.

Problem 7

(Uses calculus.) A firm has revenue $R(q) = 60q - 2q^2$ and cost $C(q) = 100 + 12q + q^2$ for $q \ge 0$. Find the profit-maximizing quantity, the price, and the profit, and verify that it is a maximum.

Show solutionHide solution

$R'(q) = 60 - 4q$ and $C'(q) = 12 + 2q$. Setting them equal, $48 = 6q$, so $q = 8$. Profit is $\pi(q) = 48q - 3q^2 - 100$, with $\pi''(q) = -6 < 0$, so $q = 8$ is the maximum of this downward parabola. Revenue is $R = Pq$, so the price is $P = 60 - 2q = 44$. Profit is $\pi(8) = 384 - 192 - 100 = 92$. Check: $R(8) = 480 - 128 = 352$ and $C(8) = 100 + 96 + 64 = 260$, difference 92.

Problem 8

For some product, $MR(k) - MC(k)$ for units 1 to 5 is $-20, -5, +10, +20, -10$. A student says: “Marginal revenue is below marginal cost on the very first unit, so the firm should make nothing.” Find the best quantity and explain which hypothesis the student overlooked.

Show solutionHide solution

By part 1 of the marginal rule, profit relative to making nothing is the running total: $-20, -25, -15, +5, -5$. The largest value is $+5$, at four units, which beats the 0 from making nothing. The student applied part 2, which requires the differences to be positive up to $q^*$ and negative after it. Here the sign goes negative, positive, negative, so part 2 does not apply, and “stop at the first unit that does not pay” is not valid. The early units lose money that the later ones more than recover, as happens when a product has high start-up costs per batch. When the sign pattern is irregular, compare totals.

Shared definitions used by this lesson's figures
# house kit: prepended to every essay figure after the std imports

# palette. AZURE and EMBER are the two actors, LEAF marks an answer, ROSE a problem
let PAPER = [1, 1, 1, 1]
let INK = [0.08, 0.09, 0.11, 1]
let SLATE = [0.40, 0.44, 0.50, 1]
let MIST = [0.85, 0.86, 0.88, 1]
let AZURE = [0.13, 0.42, 0.68, 1]
let EMBER = [0.89, 0.42, 0.12, 1]
let LEAF = [0.13, 0.55, 0.36, 1]
let ROSE = [0.78, 0.22, 0.24, 1]
let PLUM = [0.47, 0.30, 0.66, 1]
let GOLD = [0.85, 0.62, 0.08, 1]

background = PAPER

# an opaque pastel of col; use for fills so overlaps do not darken
let tint = |col, amount = 0.18| [
    1 - (1 - col[0]) * amount,
    1 - (1 - col[1]) * amount,
    1 - (1 - col[2]) * amount,
    1
]

# text: Cap for labels, Note for quiet labels, Math for typeset maths
let Cap = |txt, size = 0.75, col = INK| color{col} Text(txt, size, "Charter")
let Note = |txt, size = 0.65| color{SLATE} Text(txt, size, "Charter")
let Math = |tex, size = 0.9, col = INK| color{col} Tex(tex, size)

# a paper rectangle to sit behind text that crosses lines
let Plate = |pos, size| center{pos} fill{PAPER} stroke{alpha{0} PAPER, 0} Rect(size)

# shapes with fill and stroke both set, so no stray black appears
let Pt = |pos, col = INK, r = 0.075| center{pos} fill{col} stroke{col, 1} Circle(r, 48)
let Ring = |pos, col = INK, r = 0.1, w = 3| center{pos} fill{PAPER} stroke{col, w} Circle(r, 48)
let Seg = |a, b, col = INK, w = 3| stroke{col, w} Line(a, b)
let Path = |pts, col = INK, w = 3| stroke{col, w} Polyline(pts)
let Region = |pts, col| fill{col} stroke{alpha{0} col, 0} Polygon(pts)
let Outline = |pts, col = INK, w = 3| fill{alpha{0} PAPER} stroke{col, w} Polygon(pts)
let Shape = |pts, col, amount = 0.18, w = 3| fill{tint(col, amount)} stroke{col, w} Polygon(pts)
let Disc = |pos, r, col, amount = 0.18, w = 3| center{pos} fill{tint(col, amount)} stroke{col, w} Circle(r, 96)
let Box = |pos, size, col, amount = 0.18, w = 3| center{pos} fill{tint(col, amount)} stroke{col, w} Rect(size)
# a line from a to b ending in a small solid arrowhead
let Tip = |a, b, col = INK, w = 3, head = 0.17| {
    let d = normalize([b[0] - a[0], b[1] - a[1], 0])
    let n = [-d[1], d[0], 0]
    let base = [b[0] - d[0] * head, b[1] - d[1] * head, 0]
    return [
        stroke{col, w} Line(a, base),
        fill{col} stroke{col, 1} Polygon([
            b,
            [base[0] + n[0] * head * 0.42, base[1] + n[1] * head * 0.42, 0],
            [base[0] - n[0] * head * 0.42, base[1] - n[1] * head * 0.42, 0]
        ])
    ]
}

# plots. a frame is [x0, x1, y0, y1, centre, width, height]: a data window and the scene box it fills
let Frame = |x0, x1, y0, y1, c = [0, 0, 0], w = 6.4, h = 3.6| [x0, x1, y0, y1, c, w, h]
let fx = |fr, x| fr[4][0] + (x - (fr[0] + fr[1]) / 2) * fr[5] / (fr[1] - fr[0])
let fy = |fr, y| fr[4][1] + (y - (fr[2] + fr[3]) / 2) * fr[6] / (fr[3] - fr[2])
let at = |fr, x, y| [fx(fr, x), fy(fr, y), 0]

# axes through the data origin (or the nearest edge of the window), with optional names
let Axes = |fr, x_name = "", y_name = "", col = SLATE| {
    let ox = clamp(fr[0], 0, fr[1])
    let oy = clamp(fr[2], 0, fr[3])
    var parts = [
        Tip(at(fr, fr[0], oy), [fx(fr, fr[1]) + 0.25, fy(fr, oy), 0], col, 2.5, 0.15),
        Tip(at(fr, ox, fr[2]), [fx(fr, ox), fy(fr, fr[3]) + 0.25, 0], col, 2.5, 0.15)
    ]
    if (x_name != "") {
        parts .= center{[fx(fr, fr[1]) + 0.5, fy(fr, oy), 0]} Math(x_name, 0.8, col)
    }
    if (y_name != "") {
        parts .= center{[fx(fr, ox), fy(fr, fr[3]) + 0.5, 0]} Math(y_name, 0.8, col)
    }
    return parts
}

# tick marks with numbers at the listed data values
let XTicks = |fr, xs, col = SLATE, places = 0| block {
    let oy = fy(fr, clamp(fr[2], 0, fr[3]))
    for (x in xs) {
        . Seg([fx(fr, x), oy - 0.07, 0], [fx(fr, x), oy + 0.07, 0], col, 2)
        . center{[fx(fr, x), oy - 0.33, 0]} Math(to_string(x, places), 0.72, col)
    }
}
let YTicks = |fr, ys, col = SLATE, places = 0| block {
    let ox = fx(fr, clamp(fr[0], 0, fr[1]))
    for (y in ys) {
        . Seg([ox - 0.07, fy(fr, y), 0], [ox + 0.07, fy(fr, y), 0], col, 2)
        . center{[ox - 0.36, fy(fr, y), 0]} Math(to_string(y, places), 0.72, col)
    }
}

# faint grid lines at the listed data values
let GridLines = |fr, xs, ys, col = MIST| block {
    for (x in xs) {
        . Seg(at(fr, x, fr[2]), at(fr, x, fr[3]), col, 1.5)
    }
    for (y in ys) {
        . Seg(at(fr, fr[0], y), at(fr, fr[1], y), col, 1.5)
    }
}

# the graph of f over [a, b], drawn in the frame. values are clamped to the window
let Graph = |fr, f, a, b, col = AZURE, w = 4, n = 160|
    stroke{col, w} Polyline(map(sample(a, b, n), |x| at(fr, x, clamp(fr[2], f(x), fr[3]))))

# the region between the graph of f and the x axis over [a, b]
let AreaUnder = |fr, f, a, b, col = AZURE, amount = 0.2, n = 80| {
    var pts = [at(fr, a, 0)]
    for (x in sample(a, b, n)) {
        pts .= at(fr, x, clamp(fr[2], f(x), fr[3]))
    }
    pts .= at(fr, b, 0)
    return fill{tint(col, amount)} stroke{alpha{0} col, 0} Polygon(pts)
}

# the cake stall: total revenue and total cost in dollars when q = 0..6 cakes are made in a day
let TR = [0, 90, 160, 210, 240, 250, 240]
let TC = [60, 80, 95, 115, 140, 185, 250]
let MRv = |k| TR[k] - TR[k - 1]
let MCv = |k| TC[k] - TC[k - 1]
# plot furniture: grid, left and bottom edges, numbers along the edges, axis names
let Plot = |f, gx, gy, xname, yname, ynx = 1.0, ydx = 0.36, vx = nil| block {
    var vs = vx
    if (vx == nil) { vs = gx }
    . GridLines(f, vs, gy)
    . Path([at(f, f[0], f[3]), at(f, f[0], f[2]), at(f, f[1], f[2])], SLATE, 2.5)
    for (x in gx) {
        . center{[fx(f, x), fy(f, f[2]) - 0.3, 0]} Math(to_string(x, 0), 0.72, SLATE)
    }
    for (y in gy) {
        . center{[fx(f, f[0]) - ydx, fy(f, y), 0]} Math(to_string(y, 0), 0.72, SLATE)
    }
    . center{[(fx(f, f[0]) + fx(f, f[1])) / 2, fy(f, f[2]) - 0.66, 0]} Note(xname, 0.72)
    . center{[fx(f, f[0]) + ynx, fy(f, f[3]) + 0.32, 0]} Note(yname, 0.72)
}
let Bar = |f, x0, x1, y, col| Region([at(f, x0, 0), at(f, x1, 0), at(f, x1, y), at(f, x0, y)], col)
# a side panel readout: a quiet label with a value under it
let Read = |y, name, value, col = INK| [
    center{[2.7, y, 0]} Note(name, 0.74),
    center{[2.7, y - 0.42, 0]} Math(value, 0.95, col)
]
# bar charts by unit: cakes 1 to 6 along the bottom, dollars up the side
let FB = Frame(0.4, 6.6, 0, 100, [-0.95, 0.15, 0], 4.3, 2.9)
let BarPlot = |f, gy, yname| Plot(f, [1, 2, 3, 4, 5, 6], gy, "which cake of the day", yname, 1.1, 0.36, [])