Statistics
What a sample can and cannot tell you about the world.
The question throughout is what a sample says about the population it came from. The first lessons describe data and the normal curve. The central limit theorem and the standard error explain why averages of samples behave predictably, and confidence intervals and p-values are built directly on them. The series ends with correlation and fitting a line.
Start with lesson 1-
1
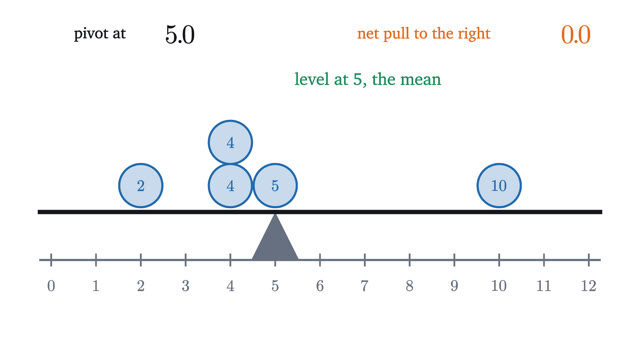
Mean, median and standard deviation: what each one saysThe mean is a balance point, the median is a middle, and the standard deviation is a typical distance. Each is the best answer to a precise question.
-
2
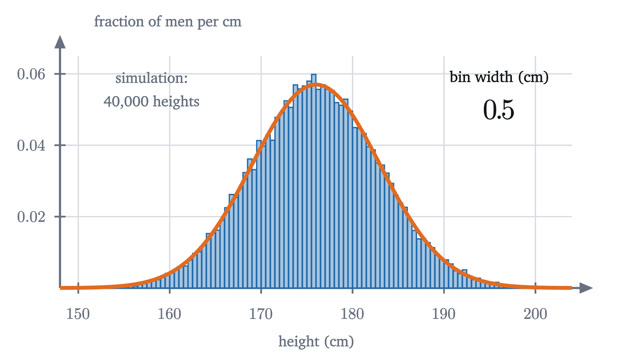
The normal distribution and the 68-95-99.7 ruleA histogram with ever narrower bins settles onto a curve whose areas are probabilities. For the bell curve, those areas give the 68-95-99.7 rule and z-scores.
-
3
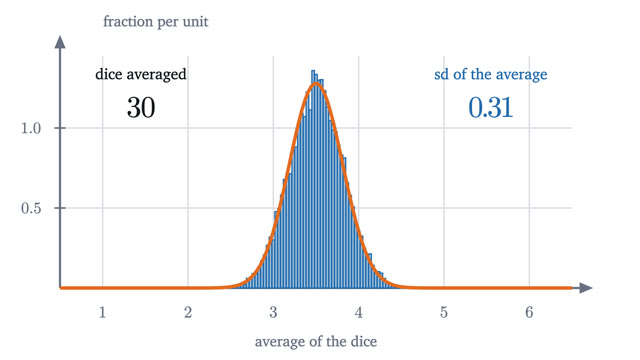
The central limit theorem: why bell curves are everywhereOne die is flat, but the average of 30 dice follows a bell curve. The central limit theorem says when this happens, how fast, and when it fails.
-
4
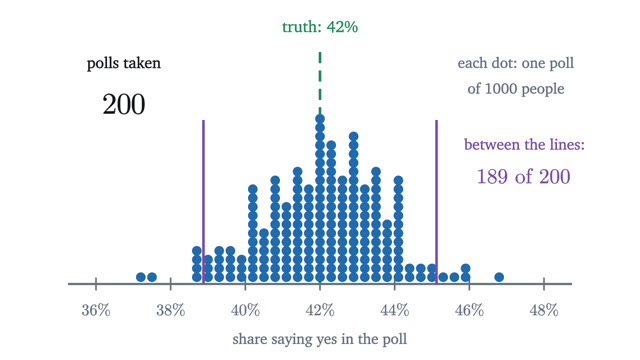
Standard error: how 1,000 people speak for a countryA random sample's accuracy depends on its own size, not on the population's. We prove the square-root law for the standard error and see its limits.
-
5
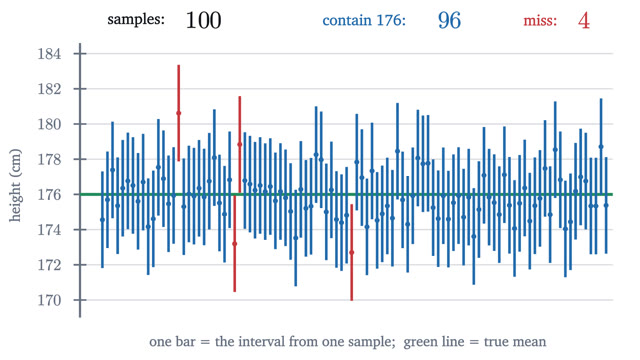
What a 95% confidence interval does and does not sayWe derive the interval mean ± 1.96 standard errors, test its 95% coverage by simulation, and go through the common misreadings and why each is wrong.
-
6
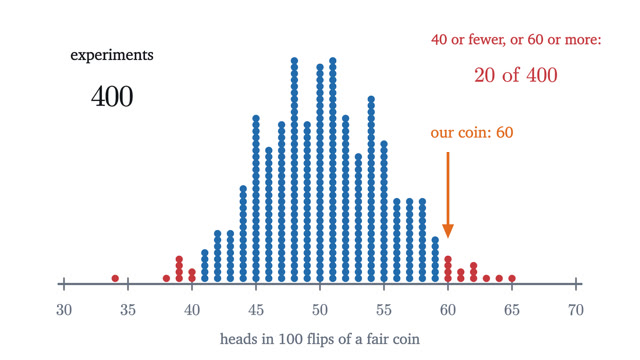
P-values and hypothesis tests without the mysticismA coin lands heads 60 times in 100. We compute the exact p-value, define the two kinds of error, and show with Bayes' theorem what a p-value is not.
-
7
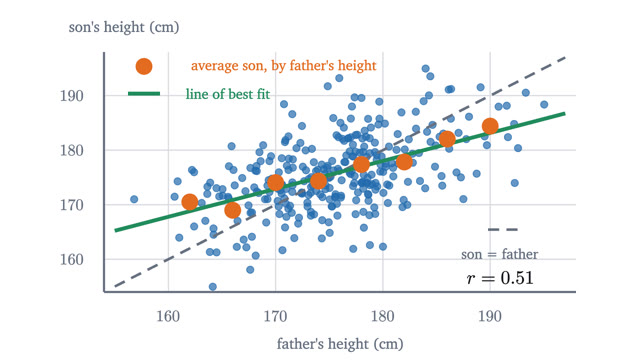
Correlation and the line of best fit, derivedWe derive the least-squares line, define the correlation r and prove it lies between -1 and 1, then explain regression to the mean and why r is not causation.